“The Predictive Power of the Term Spread and Financial Variables for Economic Activity across Countries”: The US

From a new paper, NBER WP No. 32084, by myself and Laurent Ferrara, out today.
Abstract: In recent years, there has been renewed interest in the moments of the yield curve (or alternatively, the term spread) as a predictor of future economic activity, defined as either recessions, or industrial production growth. In this paper, we re-examine the evidence for this predictor for the United States, other high-income countries, as well as selected emerging market economies (Brazil, India, China, South Africa and South Korea), over the 1995-2023 period. We examine the sensitivity of the results to the addition of financial variables that measure other dimensions of financial conditions both domestically and internationally. Specifically, we account for financial conditions indexes (Arrigoni, et al., 2022), the debt service ratio (Borio, et al., 2020), and foreign term spreads (Ahmed and Chinn, 2023). We find that foreign term spreads and the debt service ratio in many cases yield substantially better predictive power, in terms of in-sample fit using proportion of variance explained. Overall, the predictive power of the yield curve, as well as other financial variables, varies across countries, with particularly little explanatory power in emerging market economies.
For the United States, we have the following results, where we assume no recession has occurred by 2023M02: In a parsimonious regression with only term spread or term spread with short rate, the coefficients have expected sign. A financial conditions index also enters with significant and expected sign when added to this specification. However, addition of a debt-service ratio (DSR) and a foreign term spread eliminates the significance of the term spread and FCI.
In-sample prediction using the terms spread only and all variables in Figure 1.
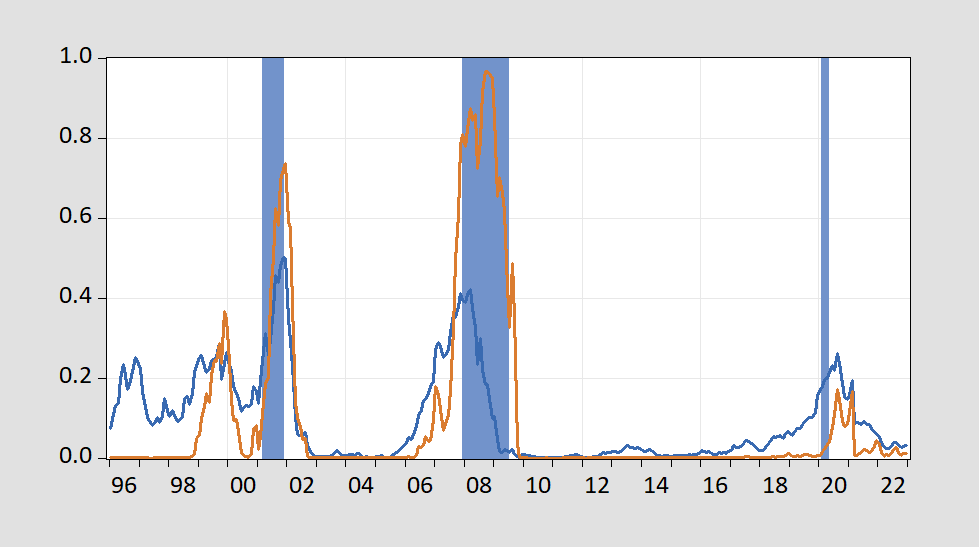
Figure 1: Estimated probability of recession from term spread only (blue), term spread, short rate, FCI, DSR, foreign term spread (tan), and NBER peak-to-trough recession dates shaded blue. Source: excerpt from Figure 2 of Chinn and Ferrara (2024).
The AUROC for the various models is shown in Figure 2.
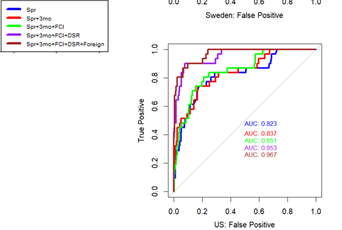
Figure 2: AUROC for US specifications. Source: excerpt from Figure 3b of Chinn and Ferrara (2024).
Note the AUROC is pretty high for the simple term spread specification. However, addition of the debt-service ratio increases prediction substantially. Interestingly, the foreign term spread (as suggested by Ahmed and Chinn (2023)) augments prediction even after addition of the DSR.
We assessed the predictive power of the individual variables at the different horizons.
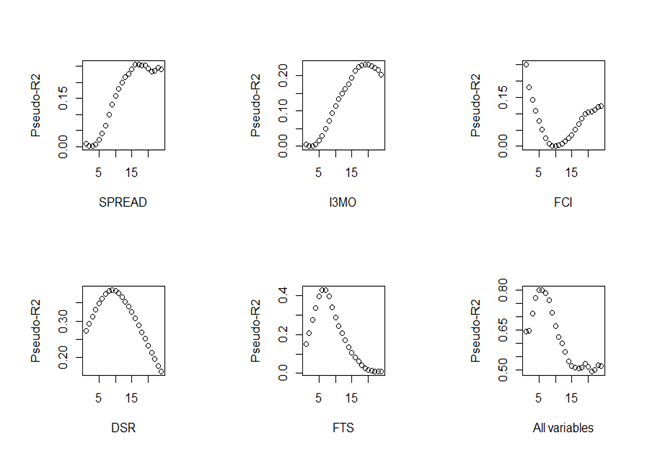
Figure 3: Psuedo-R2s for US. Source: Figure 4 from Chinn and Ferrara (2024).
The spread and short rate evidence peak prediction at about a year and a half. In contrast, the foreign term spread has peak role at about 6 months. The DSR has maximum prediction at about a year. All five variables, peak prediction at about 6 months, with pseudo-R2 at 0.8 (compared to 0.6 at 12 month horizon).
Ungated version of Chinn and Ferrara (2024).
Source link