In this post from Monday, I recounted the US results from Chinn-Ferrara (2024), using debt-service ratio data up to end-2022. The BIS has now released debt-service ratio data up to Q2. I use a regression of DSR growth rate on changes in AAA and 3 month Treasury yields, and 2 lags of DSR growth to forecast 2023Q3 DSR. I then obtain the following estimate of recession probability through 2023M09.
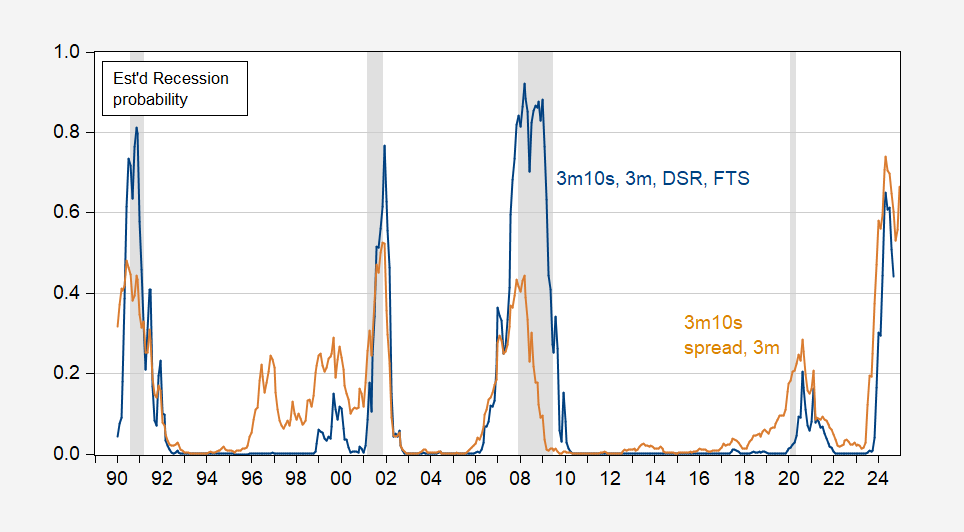
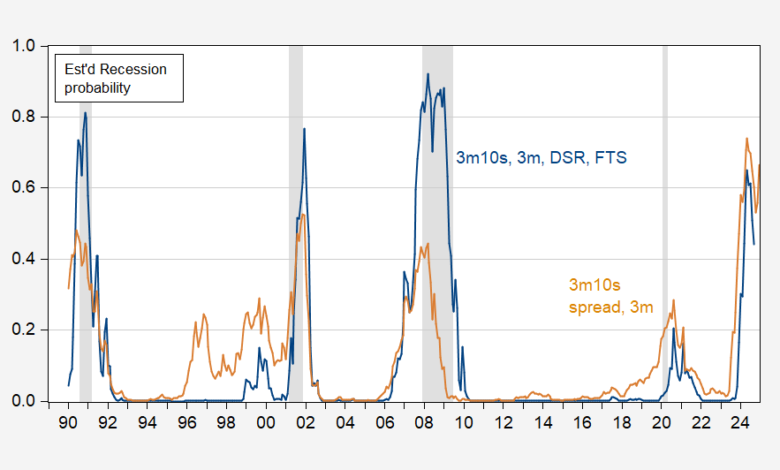
Figure 1: Probability of recession from term spread and short rate (tan), and term spread and short rate, debt-service ratio, foreign term spread (blue). NBER defined peak-to-trough recession dates shaded gray. Source: NBER, and author’s calculations.
These probability estimates are based on these series.
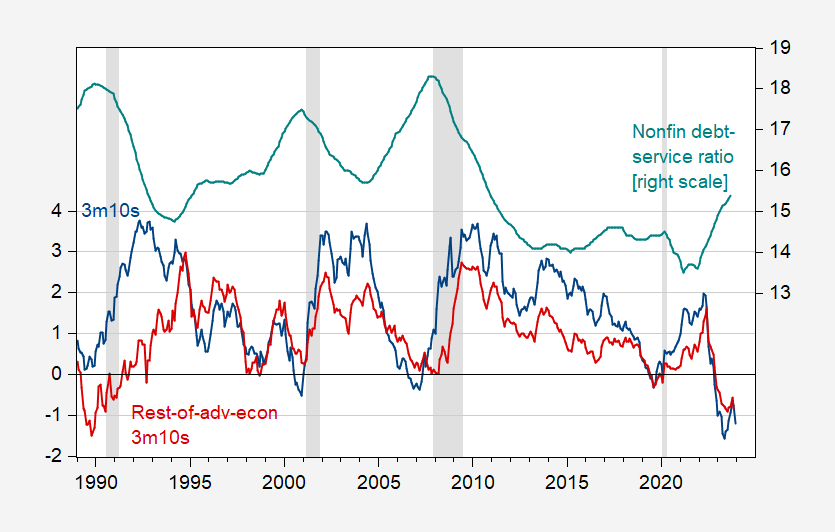
Figure 2: Ten year – three month Treasury term spread (blue, left scale), and long term-short term sovereign spread in rest-of-advanced economies, GDP weighted, both in % (red, left scale), and debt-service ratio for nonfinancial corporations, % (teal, right scale). Monthly DSR linearly interpolated from quarterly data; 2023Q3 data extrapolated as described in text. NBER defined peak-to-trough recession dates shaded gray. Source: Treasury via FRED, Dallas Fed DGEI, BIS, NBER, and author’s calculations.
The probability of recession according to either specification is quite high. A simple term spread plus short rate model indicates 56% in February, while the full specification indicates only 29%. In other words, if the full specification is the more accurate (as suggested in Chinn-Ferrara), then the absence of an obvious recession onset thus far should not be taken as proof positive a recession is going to be avoided. Peak estimated probability of recession is May 2024 (65% according to full specification).
Source link