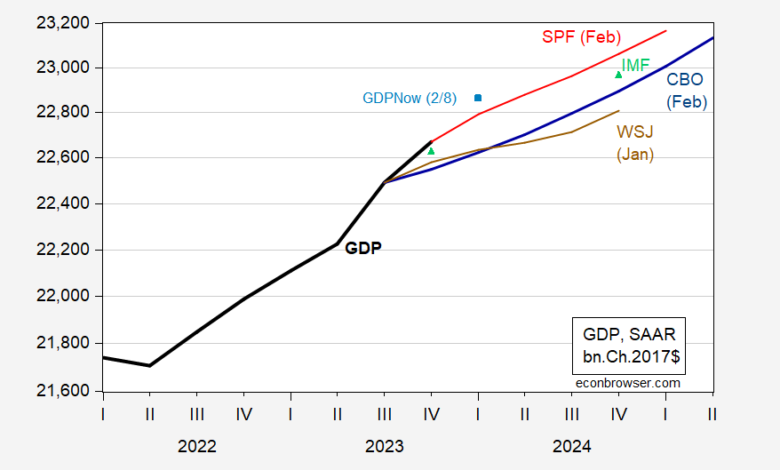
From Friday’s SPF release for Q1, for GDP:
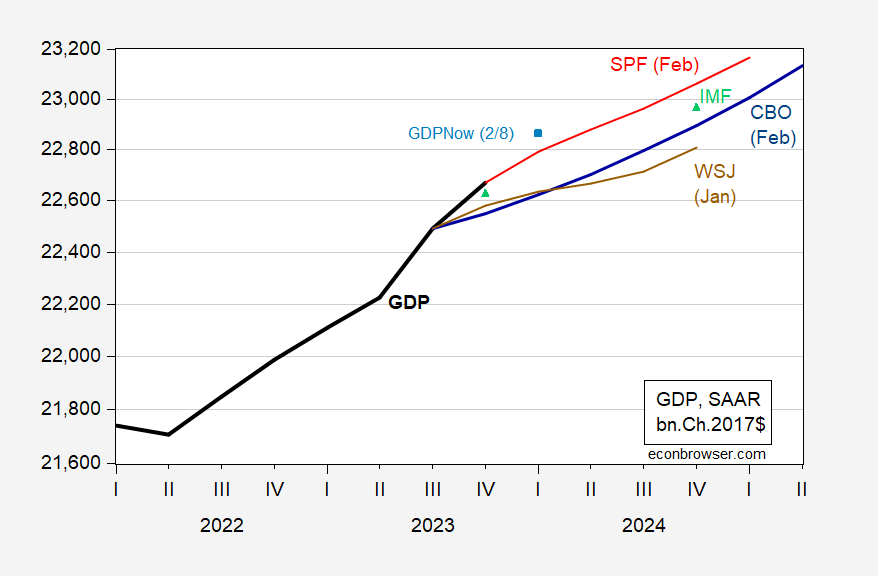
Figure 1: GDP as reported (bold black), CBO (blue), WSJ-January (brown), SPF-February (red), IMF-January (light green triangles), GDPNow (2/8/2024) (sky blue square), all in bn.Ch.2017$ SAAR, on log scale. Source: BEA, CBO (February), WSJ (January), IMF (January), Philadelphia Fed, and Atlanta Fed (2/8), and author’s calculations.
Note CBO’s projection reported in the February Budget and Economic Outlook was finalized based on date available as of December 5th. SPF is based on responses received by February 6th.
The implied level of GDP in the SPF is higher than that for CBO or IMF. However, the SPF mean forecast is up-shifted given the information available in the 2023Q4 advance release, information not incorporated into the CBO or IMF forecasts. That being said, the implied level of GDP from GDPNow still outstrips the higher implied GDP from the SPF (3.4% as of 2/8; NY Fed nowcast of 2/9 is 3.3%).
The mean path is shown above. Expectations of a quarter of negative growth have been marked down substantially, even out to 2024Q4 (35% to 26%).
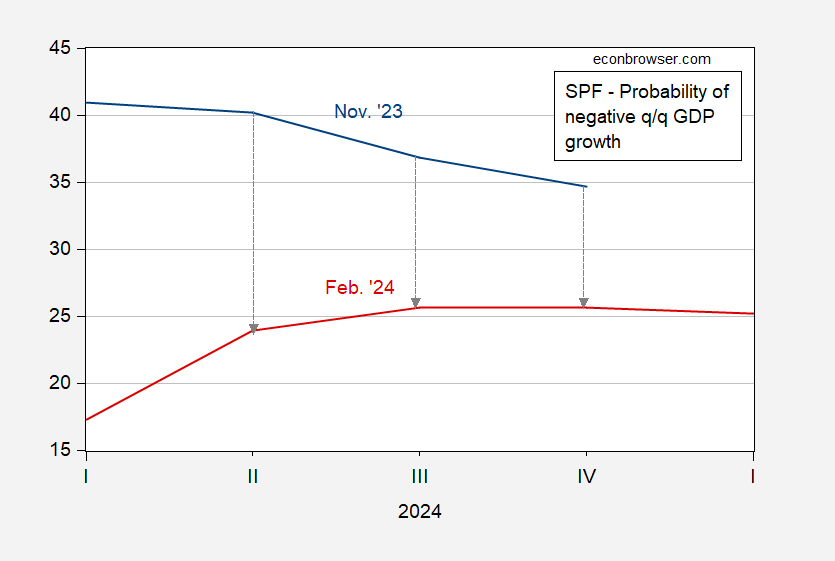
Figure 2: Probability of a negative growth in a given quarter, from November survey (blue), from February 2024 survey (red), in %. Source: Philadelphia Fed.
Source link