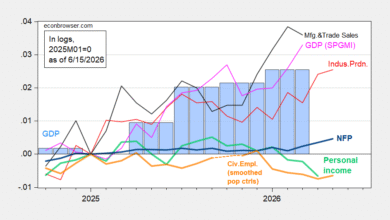
November monthly GDP is reported by S&P Global Market Insights, up 0.2 ppts, 2.6% annualized. Here’s the picture of some key indicators followed by the NBER Business Cycle Dating Committee, plus monthly GDP and GDPNow.
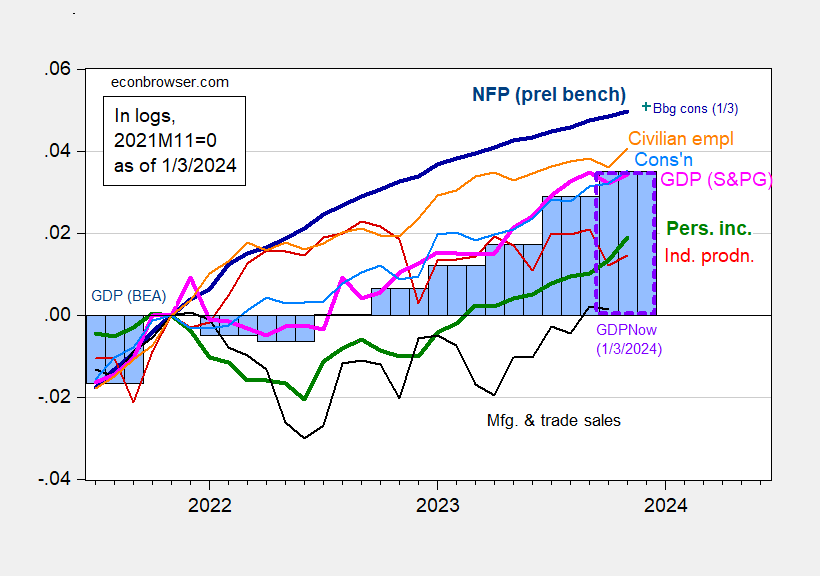
Figure 1: Nonfarm Payroll employment incorporating preliminary benchmark (bold dark blue), implied level using Bloomberg consensus as of 1/3 (blue +), civilian employment (orange), industrial production (red), personal income excluding transfers in Ch.2017$ (bold green), manufacturing and trade sales in Ch.2017$ (black), consumption in Ch.2017$ (light blue), and monthly GDP in Ch.2017$ (pink), GDP, 2nd release (blue bars), and GDPNow for 2023Q4 as of 1/3 (lilac box), all log normalized to 2021M11=0. Source: BLS via FRED, BLS preliminary benchmark, Federal Reserve, BEA 2023Q3 2nd release incorporating comprehensive revisions, S&P Global/IHS Markit (nee Macroeconomic Advisers, IHS Markit) (1/3/2024 release), Atlanta Fed, and author’s calculations.
Bloomberg consensus is for +163K NFP growth.
As of today, GDPNow for Q4 is 2.4% (q/q SAAR), S&P Global Market Insight is 0.9%, and GS at 1.4%. (NY Fed Q4 nowcast is 2.4%, while St. Louis Fed’s is 1.9%, both as of 12/29.)
Source link