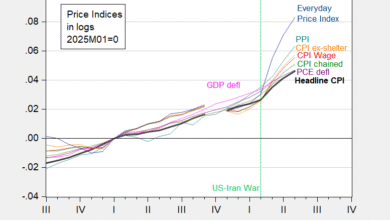
Show differing trajectories, depending on coverage, construction.

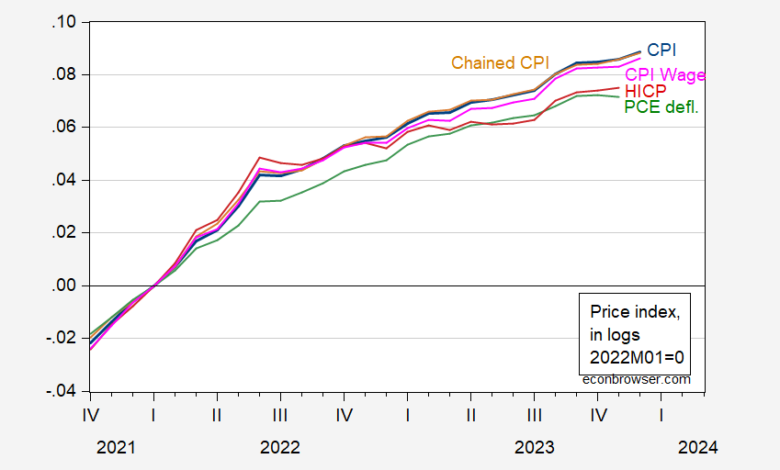
Figure 1: CPI (blue), chained CPI adjusted by author using X-13 (tan), CPI for wage and clerical workers (pink), HICP adjusted by author using X-13 (red), PCE deflator (green), all in logs, 2022M01=0. Source: BLS via FRED, BEA, and author’s calculations.
Note that PCE uses prices of goods and services as actually transacted, while CPI measures prices faced by consumers.
Source link