From the December release with headline and core slightly above Bloomberg consensus.
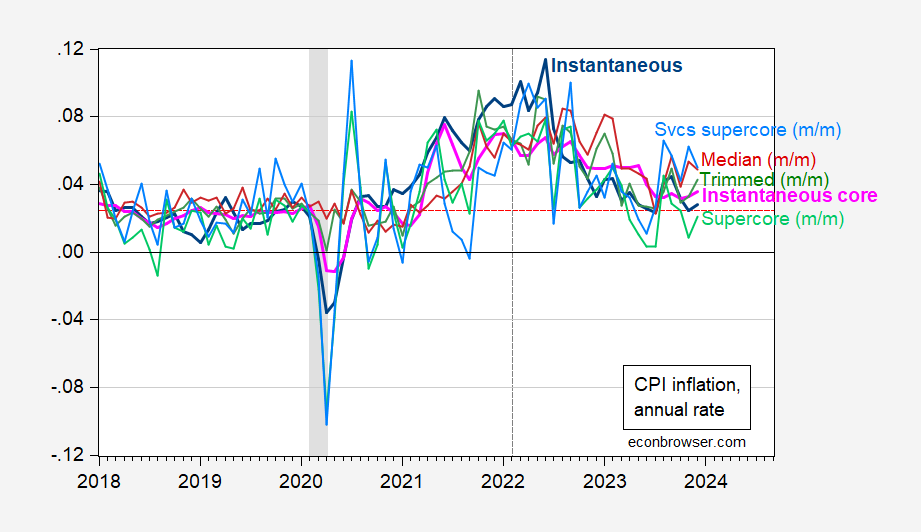
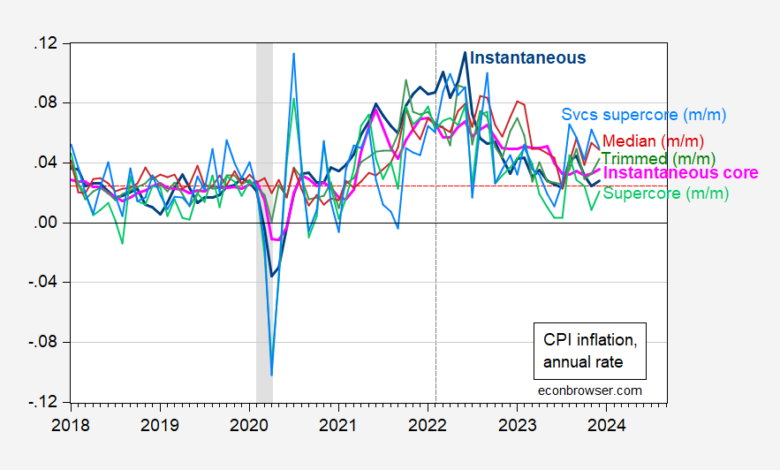
Figure 1: Instantaneous CPI inflation (T=12,a=4) (bold blue), instantaneous core CPI inflation (bold pink), m/m supercore (light green), m/m services supercore (sky blue), m/m trimmed mean CPI (green), m/m median CPI (dark red), all at annual rates. Instantaneous inflation per Eeckhout (2023). NBER defined peak-to-trough recession dates shaded gray. Red dashed line is 2.45% inflation, consistent with 2% PCE deflator inflation. Vertical dashed gray line at expanded Russian invasion of Ukraine. Source: BLS via FRED, BLS, Pawel Skrzypczinski, Cleveland Fed via FRED, NBER, and author’s calculations.
Note that instantaneous CPI inflation is near the 2.45% rate consistent with 2% PCE inflation, pre-pandemic. Neil Irwin notes the gap, or “wedge” has increased to about 2% over the past year, on a year-on-year basis. (The gap is less pronounced, only about 1.2% through November using instantaneous inflation rates.)
Median and mean CPI inflation (m/m on annualized basis) are above instantaneous CPI inflation, and rising. Each of these measures have their adherents as indicators of current inflation, and separately, trends. Services supercore above supercore suggests that services inflation remains persistently high.
Source link