The Employment Situation release for January 2024 incorporated annual benchmark revisions to establishment survey series, and reported population controls for the household survey series. NFP at +353 vs. +187 thousands Bloomberg consensus. (Last year at this time, NFP again surprised, at +517 thousand exceeding the Bloomberg consensus of +115 thousand.)
Here’s nonfarm payroll employment according to several measures.
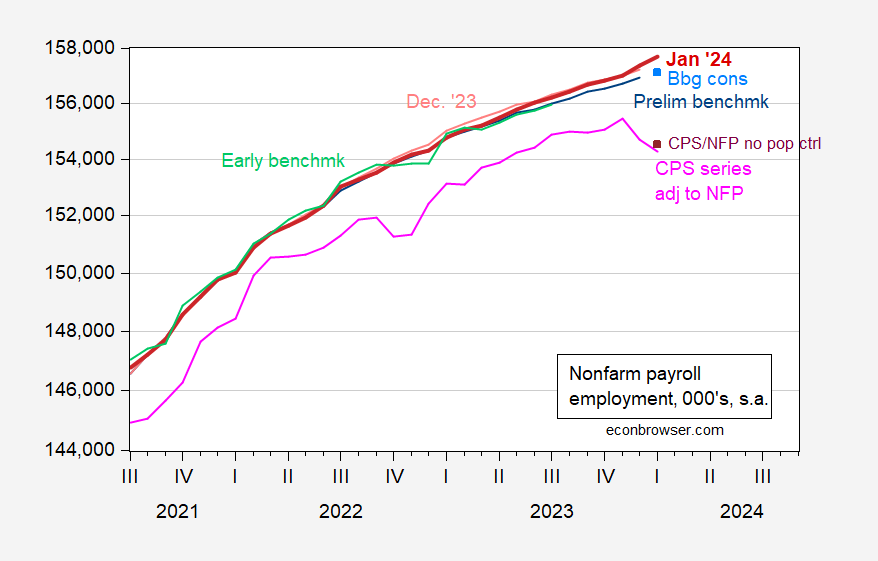
Figure 1: Nonfarm payroll employment from January 2024 incorporating benchmark revision (bold red), NFP from December 2023 (light red), and author’s calculation of implied benchmark revision using preliminary benchmark for March 2023 (blue), implied level from preliminary benchmark by author and Bloomberg consensus change for January (light blue square), Philadelphia Fed early benchmark (light green), and household survey series on civilian employment adjusted to NFP concept as reported (pink), and for January 2024, adjusted household series removing effect of revised population controls (purple square). Adjustment to remove revised population controls assumes overall civilian employment increases 0.957 of total control for all civilian employment. Source: BLS (January 2024, December 2023 releases), author’s calculations, BLS.
Surprising (to me) is that the benchmark revised series far exceeded the preliminary benchmark revision I calculated (blue line), and the early benchmark calculated by the Philadelphia Fed (light green line).
The CPS employment series adjusted to the NFP concept (a research series, not official), shows a sharp decline, mirroring the decline in the civilian employment series. A similar decline occurred a year ago, with the implementation of new population controls. I attempted to get a feeling for what impact new population controls might have, by using the ratio of adjusted employment to total employment (about 0.957) to adjust the -270 thousands coming from the January population control. This shows up as the purple square in Figure 1. Hence, unlike last year, the implied decline is not erased. That being said, it is important to recall that the population survey series incorporate much larger sampling error than the establishment survey series. For tracking business cycle movements, the household survey based series are typically less informative than the establishment survey based series.
The January seasonal effect is quite large, typically. Hence, it is of interest to consider how big an impact a possible mis-estimation of the seasonal component might have. One way to see this is to compare the 12 month change in the seasonally adjusted and not seasonally adjusted series. This is shown in Figure 2.
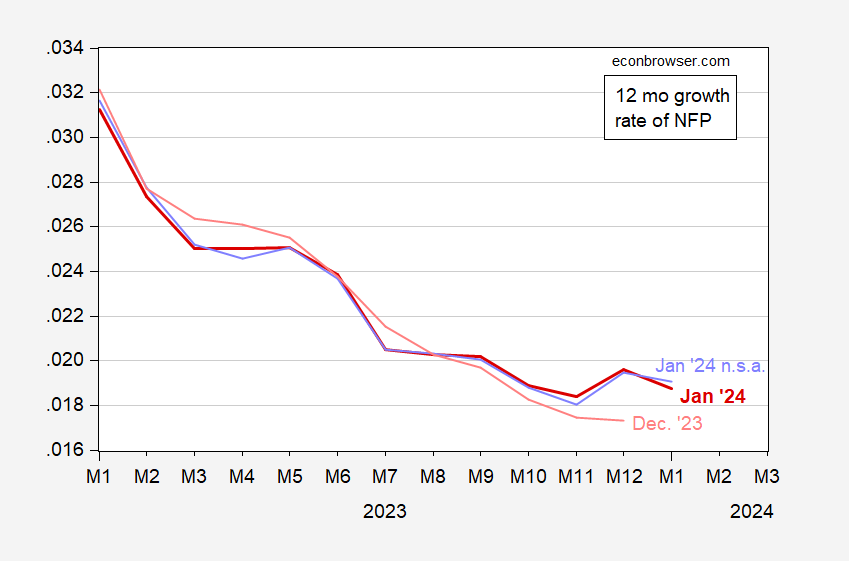
Figure 2: Twelve month change in nonfarm payroll employment, January release (bold red), from not seasonally adjusted, January release (lilac), and December 2023 (light red), all calculated in log differences. Source: BLS and author’s calculations.
Note the y/y growth rates from the seasonally adjusted and seasonally adjusted series for January 2024 do not differ a lot. On the other hand, the seasonally adjusted series for January 2024 vs. December 2023 do differ substantially.
Source link