Today we present a guest post written by Matías Scaglione and Romina Soria, co-founders of the data science and economic consulting firm Motio Research. This post offers a concise introduction to a new monthly series of U.S. household income data officially launched by Motio Research in December 2023.
Motio Research, a data science and economic consulting firm, officially launched a monthly series of household income data for the United States in December 2023. The new series is based on microdata from the Current Population Survey and follows the core methodology of a discontinued series that garnered widespread national media attention in the 2010s.
As co-founders of Motio Research, we believe that this monthly series offers a key, timely gauge of the economic well-being of American households. It stands in contrast to the published official estimates, which are reported on a calendar-year basis and suffer from a significant delay between data collection and publication.
Background
In October 2011, the consulting firm Sentier Research, led by two former U.S. Census Bureau officials, began publishing a monthly series of household income data for the United States based on Current Population Survey (CPS) microdata. The CPS is the primary source of labor force statistics for the United States and had not been utilized to produce monthly household income estimates until that time.
For the first time, this new series introduced monthly estimates of U.S. median household income, derived from the pre-tax money income that households report earning in the previous twelve months. In contrast, the official Census estimate of median household income is reported on a calendar-year basis and suffers from a significant delay between data collection and publication, with data for a given calendar year being published in September of the following year.
The novel household income estimates were widely cited by national media outlets and policymakers as an important monthly indicator of the economic well-being of households in the United States (see coverage examples here, here, and here). Sheila Bair, who served as the Chair of FDIC during the Great Recession, notably chose a chart displaying Sentier’s median household income index for The Washington Post as the most significant graph of 2013 (see article). The Sentier series led Bair to conclude in December 2013 that “for a large number of American households, there has been no economic recovery.”
The Sentier income series kept providing valuable information on the monthly trend of U.S. household incomes in the aftermath of the Great Recession and during the ensuing economic recovery, until December 2019. In early 2020, Sentier announced the cessation of its operations due to financial difficulties, resulting in the discontinuation of the series. Since then, a monthly series of U.S. household income exclusively derived from CPS microdata has not been released.
In December 2023, we launched a new series of monthly U.S. household income data, following the core methodology employed by Sentier and incorporating improvements that enhance the series’ stability and predictive performance.
Data and method
Our monthly series of household income data are derived from monthly CPS microdata published by the U.S. Census Bureau. The CPS is a nationally representative survey with a sample size of roughly 60,000 eligible households, covering the noninstitutionalized civilian population.
The official series of annual median household income is calculated using a different data set, a supplement to the CPS called the Annual Social and Economic Supplement (ASEC). This survey has a current sample size of more than 75,000 households and is designed to capture poverty and income characteristics of the population for the previous calendar year.
The income question included in the monthly CPS asks households to report their total income in the last twelve months, including “money from jobs, net income from business, farm or rent, pensions, dividends, interest, social security payments, and any other money income received” from all household members ages fifteen or older. Respondents are asked to select from sixteen income intervals.
Households included in the CPS are surveyed for eight months in total, spending four consecutive months in the survey since their entrance, being then taken out from the survey for eight consecutive months, and then being reintroduced into the survey for their final four consecutive months. Respondents can be grouped according to their month in the survey, so there are eight groups of roughly similar size of respondents each month.
A key issue for the computation of our monthly household income estimates is that “fresh” household income data is only available in the first and fifth months of the respondent’s tenure in the survey, with the remaining two sets of consecutive months (2, 3, and 4; and 6, 7, and 8) carrying forward the values reported in months 1 and 5, respectively. Fresh household income data thus represents roughly one-fourth of the monthly sample, but we have decided to adhere to Sentier’s approach of utilizing the entire sample, considering the high volatility associated with a series reliant solely on the most current data.
The first step in the computation of our household income series is the imputation of actual income values derived from the sixteen income brackets that households use to report their income over the last twelve months. For the bottom fifteen income intervals, we followed the method used by Sentier, where income values are derived by income bracket following a uniform distribution. For the top bracket, we use a Pareto interpolation, where income values are derived following a standard Pareto distribution.
The inflation adjustment must be performed at the microdata level due to the co-existence of four different months’ worth of past twelve-months income data within each monthly survey. We adjust the household income values using the seasonally-adjusted Consumer Price Index for All Urban Consumers (CPI-U). Household income values are adjusted for inflation according to the household’s month in the survey, using twelve-month averages of the CPI-U.
The resulting series are adjusted for seasonality using the X-13ARIMA-SEATS software, which is produced, distributed, and maintained by the Census.
The Motio Median Household Income Index
The initial series made available to the public is the Motio U.S. Median Household Income Index (MHII), a median household income index adjusted for inflation and seasonality. An interactive chart of the index is available at motioresearch.com/household-income-series/. The index is updated shortly after both the CPS file and the U.S. Consumer Price Index for the reference month become available, typically in the second to third week of each month subsequent to the reference month.
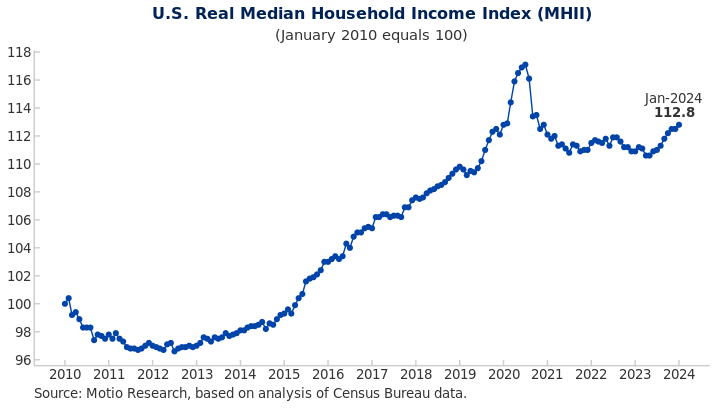
The MHII begins with a value of 100.0 in January 2010 and reaches a value of 112.8 in January 2024, equivalent to $77,397 (see chart below). The index initially declined, reflecting the lingering impact of the Great Recession until mid-2011. Subsequently, it experienced a prolonged bottom until mid-2012 and then consistently rose until the onset of the Covid pandemic.
The spike and sharp decline in March-October 2020 are primarily attributed to the effect of nonresponse bias in the CPS during the initial months of the pandemic. Nonresponse bias in this case refers to the fact that lower-income households were less likely to respond to the survey (see Ward and Anne Edwards, 2021). We recommend taking the February 2020 value as the peak for 2020 for practical purposes.
Real median household income declined thereafter and plateaued below the pre-Covid maximum value since early 2021, amid historically high inflation. The index reached a post-Covid minimum value in April-May 2023 and has shown renewed strength since June 2023. With a value of 112.8 in January 2024, the index is approaching the pre-Covid peak of 112.9 observed almost four years ago, in February 2020.
In closing, and to reiterate, we believe that tracking monthly household income trends provides a unique vantage point into the evolving economic well-being of American households. Our commitment is to deliver accurate, timely, and comprehensive data and analysis to thoroughly inform this perspective.
References
Ward, Jason M., and Kathryn Anne Edwards. 2021. “CPS Nonresponse During the COVID-19 Pandemic: Explanations, Extent, and Effects.” Labour Economics 72: 102060. doi:10.1016/j.labeco.2021.102060. URL https://www.sciencedirect.com/science/article/pii/S0927537121000956
This post written by Matías Scaglione and Romina Soria.
Source link

