Or, why has the US done so well. Part of it’s immigration. From Goldman Sachs “Upgrading Our GDP and Payrolls Forecasts to Reflect Elevated Immigration (Walker)” released yesterday:
Recent studies suggest that Census data used for the household survey of the employment report understated immigration in 2023. We estimate that immigration was 1½mn above the trend of roughly 1mn per year in 2023, which implies an 80k boost to the monthly breakeven rate of job growth to 155k. We expect immigration to be about 1mn higher than usual this year, implying breakeven job growth of around 125k and a 0.3pp boost to potential GDP growth in 2024 from faster labor force growth.
We have updated our payrolls and GDP forecasts to incorporate the ongoing boost from above-trend immigration. We now expect payroll growth to average 175k/month this year and slow to 150k/month by year-end, though we expect this to only lower the unemployment rate a touch to 3.8% by year-end. We have also raised our 2024 real GDP growth forecast by 0.3pp to +2.4% on a Q4/Q4 basis (or +2.7% on a full-year basis), mostly by upgrading consumption growth.
This follows on the back of a report in the Economist this week, as well as a CBO report (on demographics) earlier. The most comprehensive analysis of the business cycle implications is in a Brookings report by Wendy Edelberg and Tara Watson.
One way to see the impact of immigration on the supply side is to see the what happened to the change in the labor force — foreign born and native born — over time.
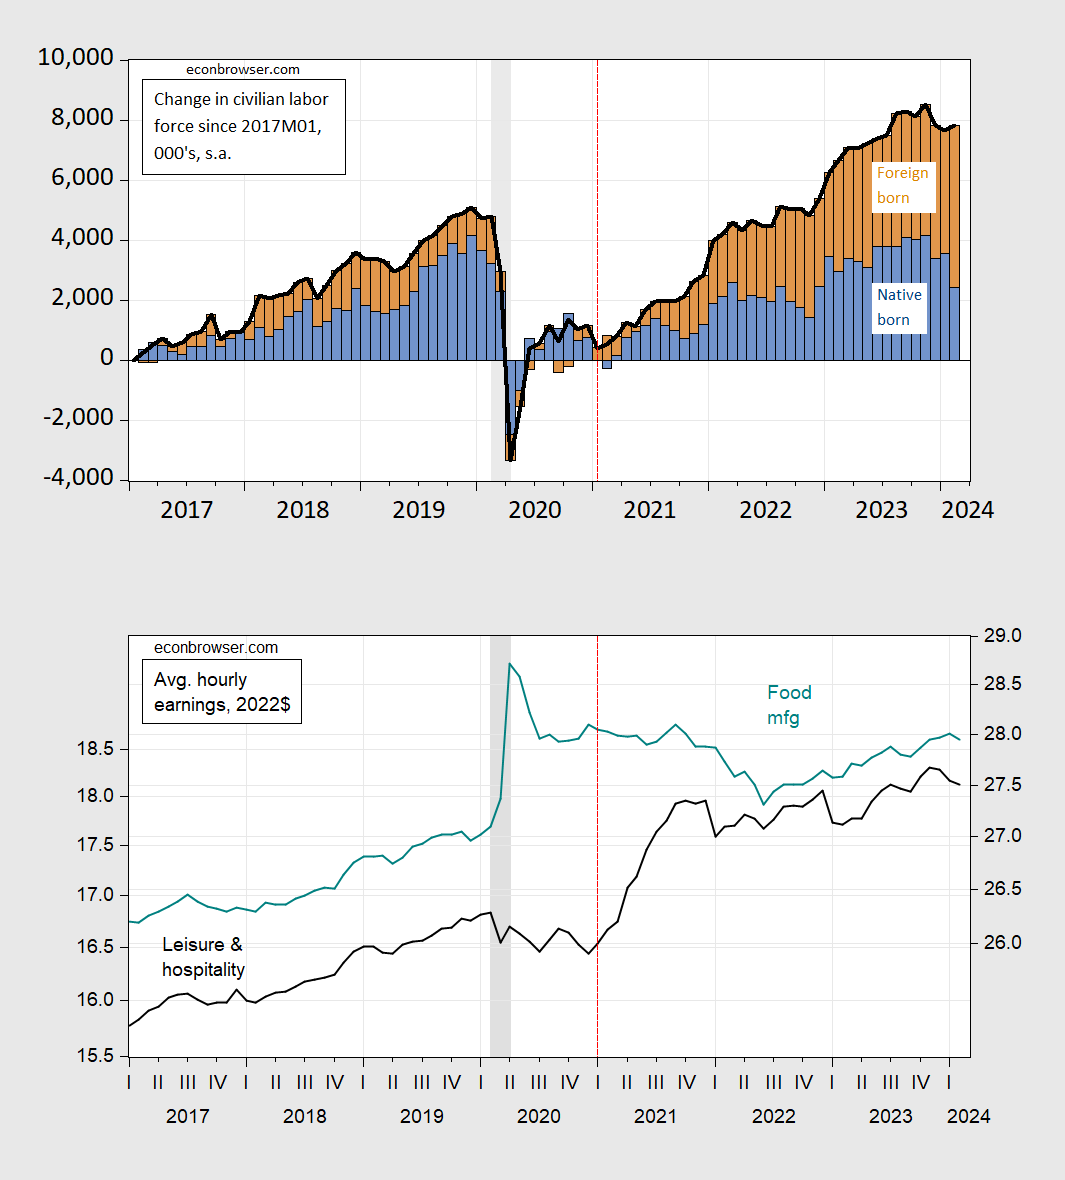
Figure 1: Top panel: Change in labor force since 2017M01 (black line), native born (blue bars), foreign born (tan bars), all in 000’s, s.a. Bottom panel: Average hourly earnings of leisure and hospitality services, production and nonsupervisory workers (black, left scale), of food manufacturing (teal, right scale), both in 2022$. NBER defined peak-to-trough recession dates shaded gray shaded gray. Red dashed line at start of Biden administration. Source: BLS, NBER and author’s calculations.
Note that as the foreign born share of the change in the labor force increases, wages stop rising (for leisure and hospitality) and fall slightly in food manufacturing, before rising again.
How would I interpret the shocks in an AD-AS model? In Figure 2, immigration shifts out potential GDP (Yn), even as AD shifts to right.
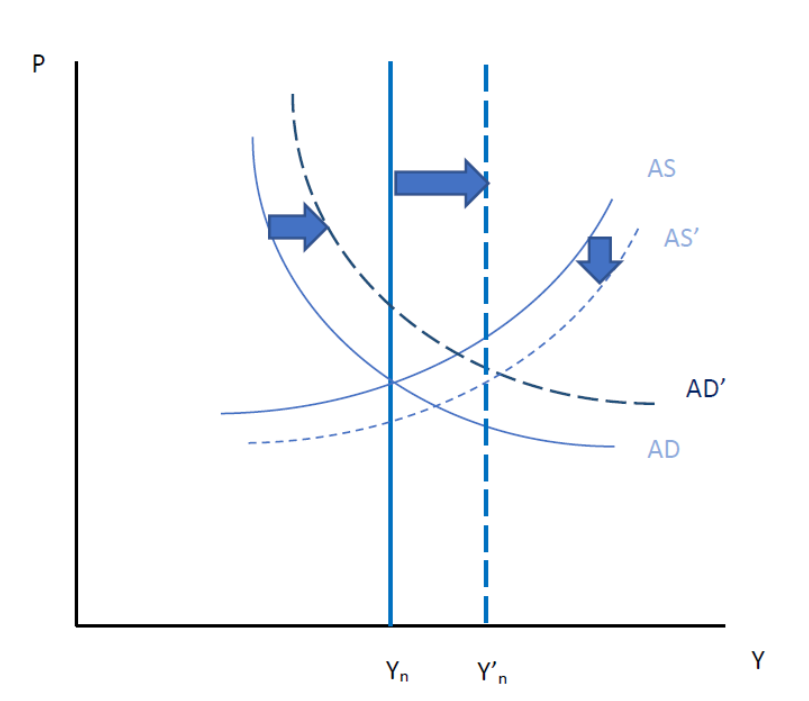
Figure 2: AS and AD shifts with immigration influx.
The reversion of labor force to trend, in part by additions of foreign born individuals, shifts out the long run (vertical) Aggregate Supply curve as Yn rises to Y’n. This pulls down the short run Aggregate Supply curve to AS’. The increase in population associated with the higher pace of immigration shifts out aggregate demand to AD’. In this depiction, the price level rises only modestly compared to what would have happened had the increase in labor force not occurred.
Source link