In tomorrow’s lecture on the Phillips Curve and the recent inflation surge for Econ 442, I ask whether a modifed Blanchard-Cerutti-Summers (2015) Phillips Curve specification can predict the disinflation. Answer: Yes.
BCS use:
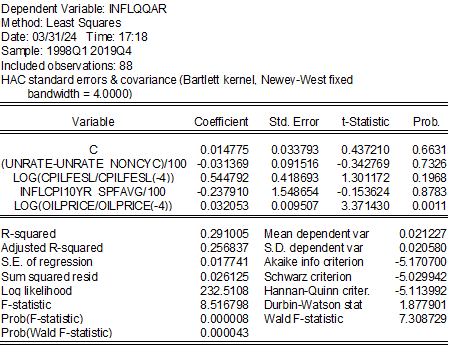
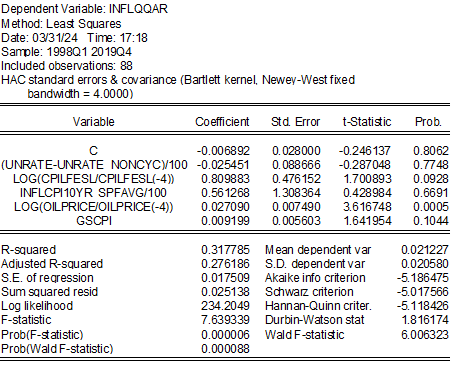
I modify by (1) unconstraining the coefficients on expected and lagged y/y inflation, (2) using lagged y/y core instead of headline CPI, (3) using the relative inflation rate of oil instead of imported materials, and/or (4) adding the NY Fed’s Global Supply Chain Pressure Index (GSCPI). I then estimate 1998-2019 (the sample dictated by availability of the GSCPI, and avoiding the pandemic):
Augmenting with GSCPI.
The unemployment gap comes in with the right sign, albeit not statistically significantly so. Oil price inflation is quite significant, as is the GSCPI. Note the impact of the GSCPI comes in a sample that predates the covid pandemic.
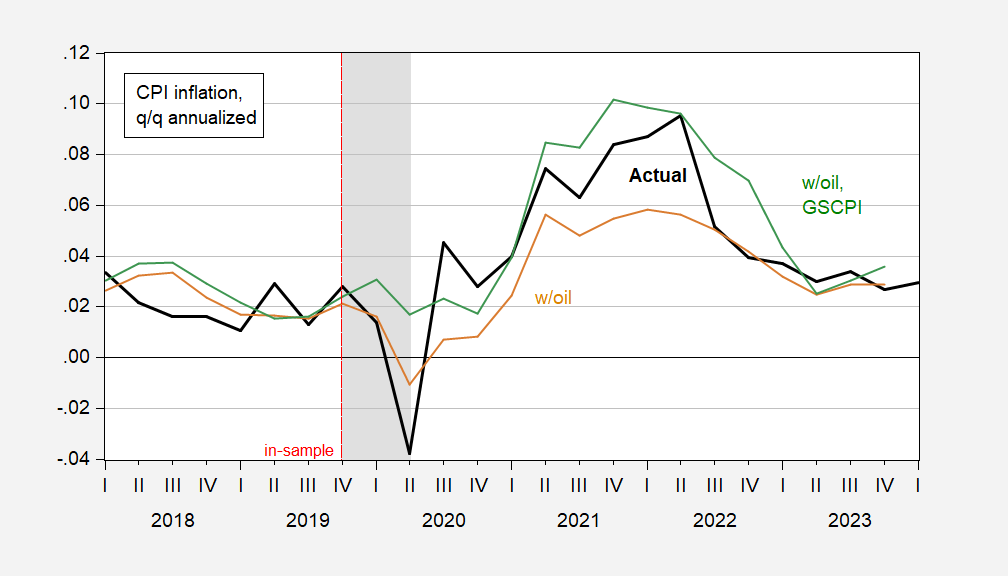
Using these two regressions to conduct out of sample predictions, I obtain the following:
Figure 1: Quarter-on-Quarter CPI inflation annualized (bold black), out-of-sample fit from modified BCS regression (tan), and from modified BCS regression augmented with GSCPI (green). NBER defined peak-to-trough recession dates shaded gray. Source: BLS, NBER, and author’s calculations.
Mean Error (RMSE) for the w/oil specification is 1.3%(1.4%) and for the w/oil, GSCPI is -1.0%(1.2%), with 12 observations 2021Q1-2023Q4.
The fact that the GSCPI-augmented equation predicts the inflation and disinflation better than the oil-alone specification suggests to me that the unexpected (by some) persistence of inflation is due to the unanticipated disruptions in supply chains.
Source link


