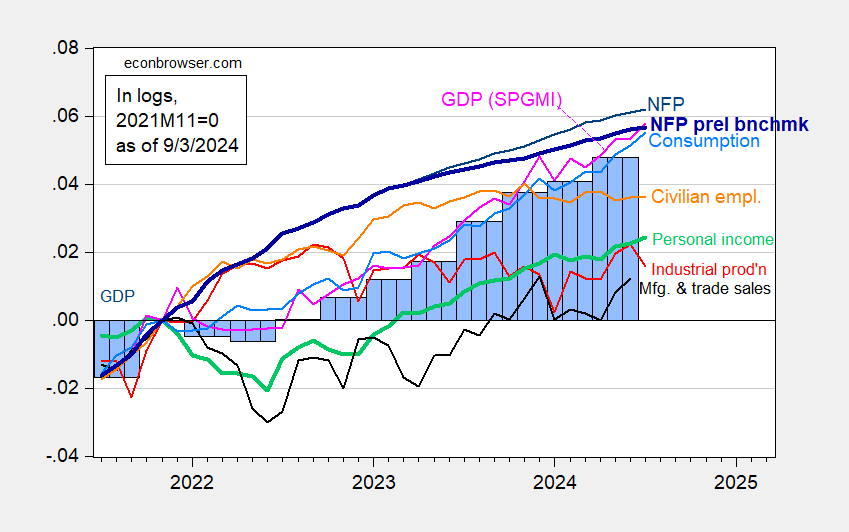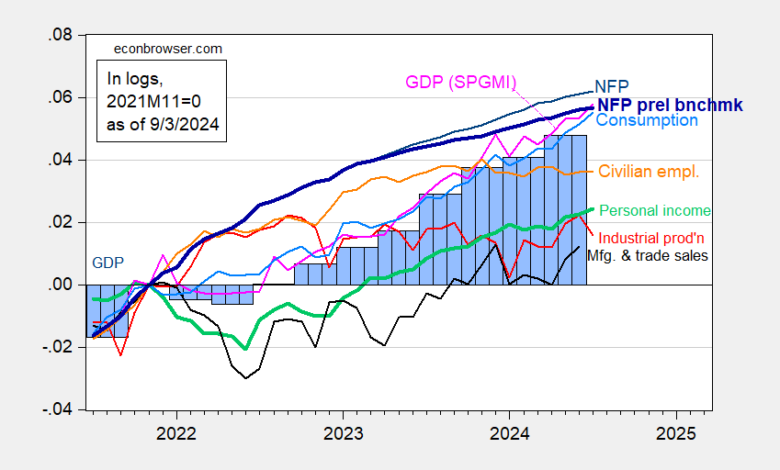
Including monthly GDP out today from S&P Global Market Insights, and preliminary benchmark NFP:
Figure 1: Nonfarm Payroll (NFP) employment from CES (bold blue), implied NFP from preliminary benchmark (bold blue), civilian employment (orange), industrial production (red), personal income excluding current transfers in Ch.2017$ (bold green), manufacturing and trade sales in Ch.2017$ (black), consumption in Ch.2017$ (light blue), and monthly GDP in Ch.2017$ (pink), GDP (blue bars), all log normalized to 2021M11=0. Source: BLS via FRED, Federal Reserve, BEA 2024Q2 2nd release, S&P Global Market Insights (nee Macroeconomic Advisers, IHS Markit) (9/3/2024 release), and author’s calculations.
S&P GMI notes:
Monthly GDP rose 0.4% in July following a flat reading in June that was revised lower by 0.2 percentage point. The increase in July was fully (and roughly equally) accounted for by increases in personal consumption expenditures and nonresidential fixed investment. Outside of these components, a jump in nonfarm inventory investment in July was roughly offset by a decline in net exports.
Hence, even taking literally the preliminary benchmark (see this post regarding why you might not want to), July indicators are not suggestive of a recession starting in July (keeping in mind all series will be further revised over time).
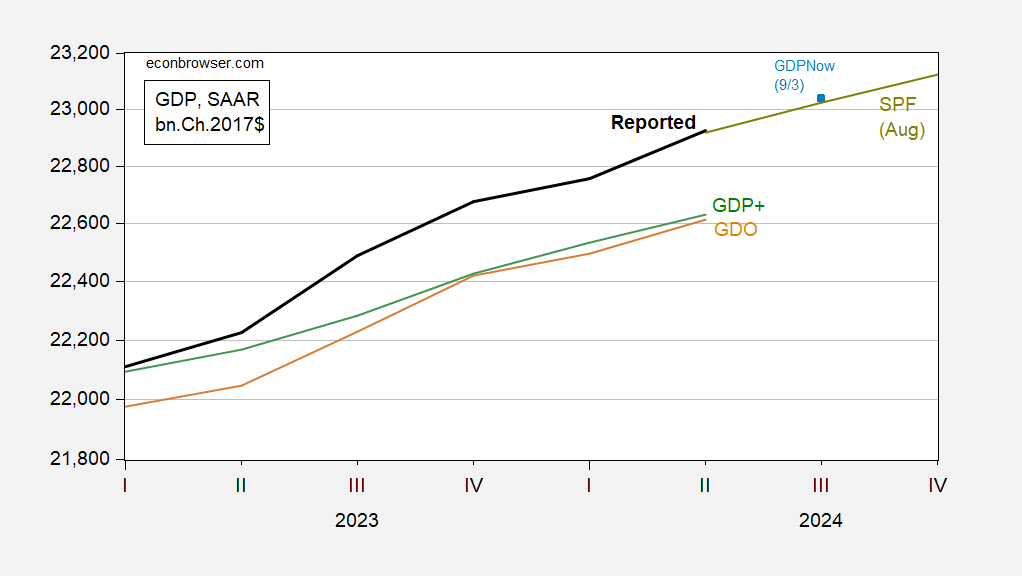
GDPNow for Q3 now at 2%, down from 2.5% on 8/30. 2% is still trend growth, so I would be loath to say the downturn is here in Q3.
Figure 3: GDP as reported (bold black), GDPNow as of 9/3 (blue square), GDP median forecast from Survey of Professional Forecasters (chartreuse line), GDO (tan), GDP+ (green), all in bn.Ch.2017$ SAAR. GDP+ calculated by iterating GDP+ growth rates on 2019Q4 GDP level. Source: BEA 2024Q2 2nd release, Atlanta Fed, Philadelphia Fed (SPF 8/9), Philadelphia Fed (GDP+ 8/29), and author’s calculations.
Source link

