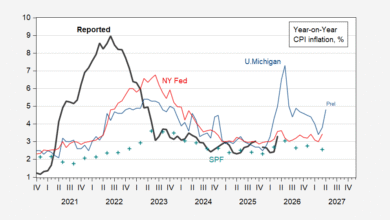
Michigan Survey of Consumers and yesterday’s release of the Survey of Professional Forecasters agree.
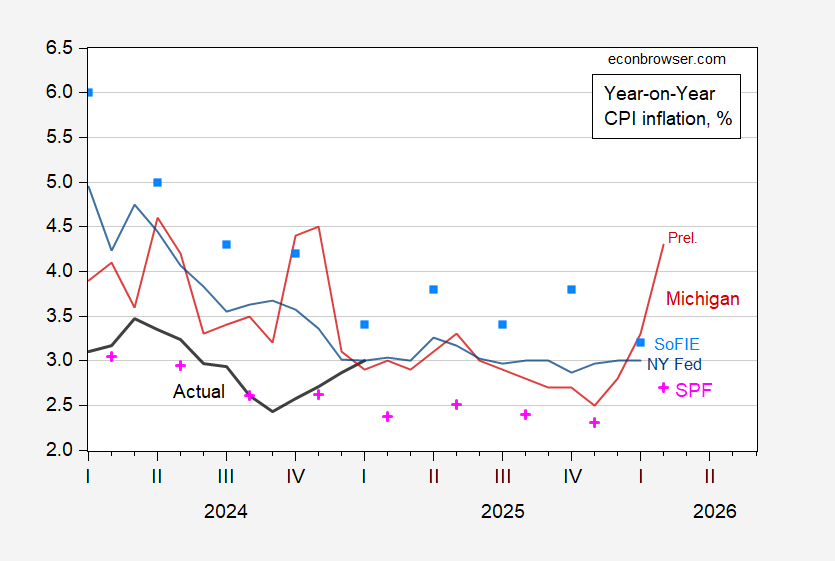
Figure 1: Actual CPI inflation (black), Michigan survey (red), NY Fed survey (blue), Cleveland Fed SoFIE (light blue square) and Survey of Professional Forecasters (pink +), all year-on-year, in %. Michigan February is preliminary. Source: BLS, NY Fed, Cleveland Fed, Philadelphia Fed, and author’s calculations.
From November to February Michigan (prel.) change in y/y is 1.8 ppts. For SPF, it’s 0.4 ppts.
Source link