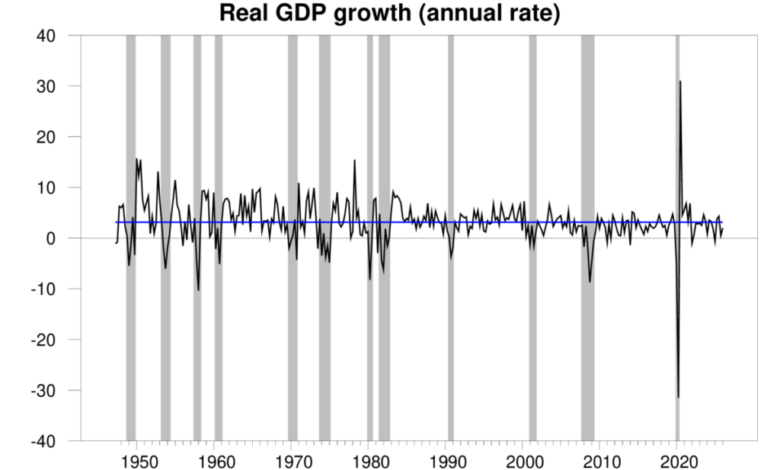
The Bureau of Economic Analysis announced today that seasonally adjusted U.S. real GDP grew at a 2% annual rate in the first quarter. That is below the historical average growth of 3.1% and also below some analysts’ expectations for the Q1 numbers. The new BEA report also revised down the estimate of the Q4 annual growth rate. The latter was originally reported to have been 1.4% but is now estimated to have only been 0.5%.
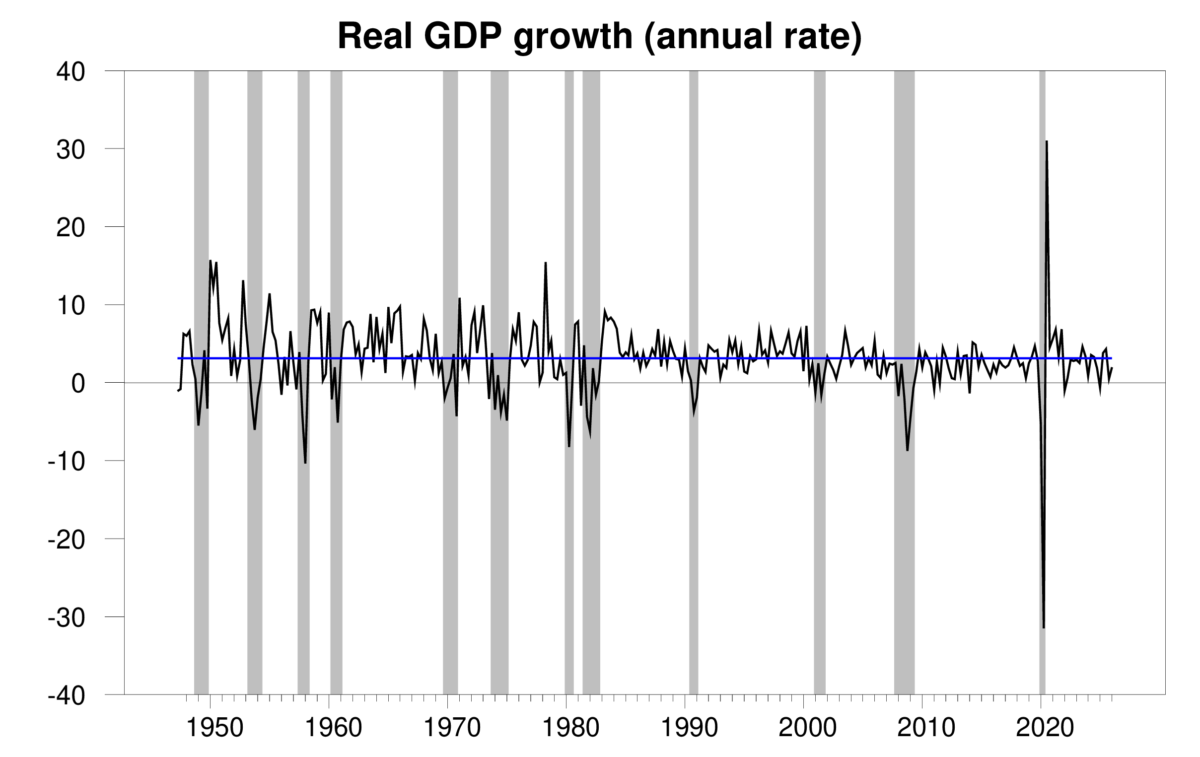
Quarterly real GDP growth at an annual rate, 1947:Q2-2026:Q1, with the historical average since 1947 (3.1%) in blue. Calculated as 400 times the difference in the natural log of real GDP from the previous quarter.
The new numbers bring the Econbrowser recession indicator index up to 7.7%. This uptick largely reflects the fact that Q4 is now reported to be rather weak. Our procedure has always been to wait one quarter for data revisions and better pattern recognition before announcing the index. The revisions to the Q4 GDP numbers illustrate one of the reasons this is desirable.
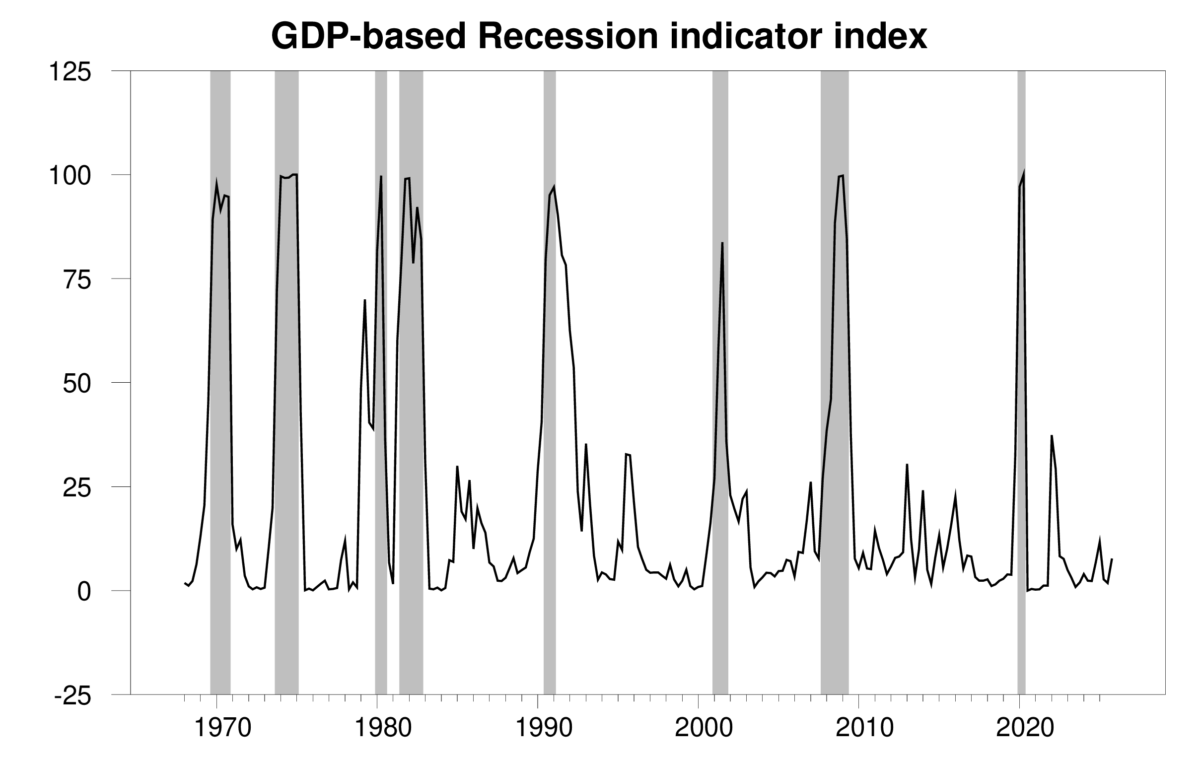
GDP-based recession indicator index. The plotted value for each date is based solely on the GDP numbers that were publicly available as of one quarter after the indicated date, with 2025:Q4 the last date shown on the graph. Shaded regions represent the NBER’s dates for recessions, which dates were not used in any way in constructing the index.
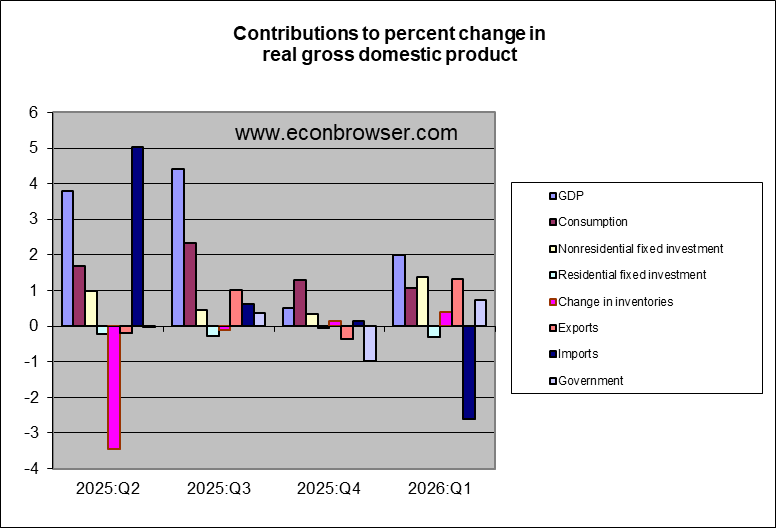
Nonresidential fixed investment, in part propelled by spending for AI infrastructure, seemed to contribute significantly to the Q1 growth. But many of these components were imported, so the net contribution to U.S. GDP — which measures production of new goods in the United States — was more muted. Consumption spending was weaker than it has been recently.
Some analysts have wondered whether the surge in oil prices could have played a role in the softness in consumption spending. Consumer sentiment, which often moves inversely with gasoline prices, has been pretty low, though this started before the recent oil price surge.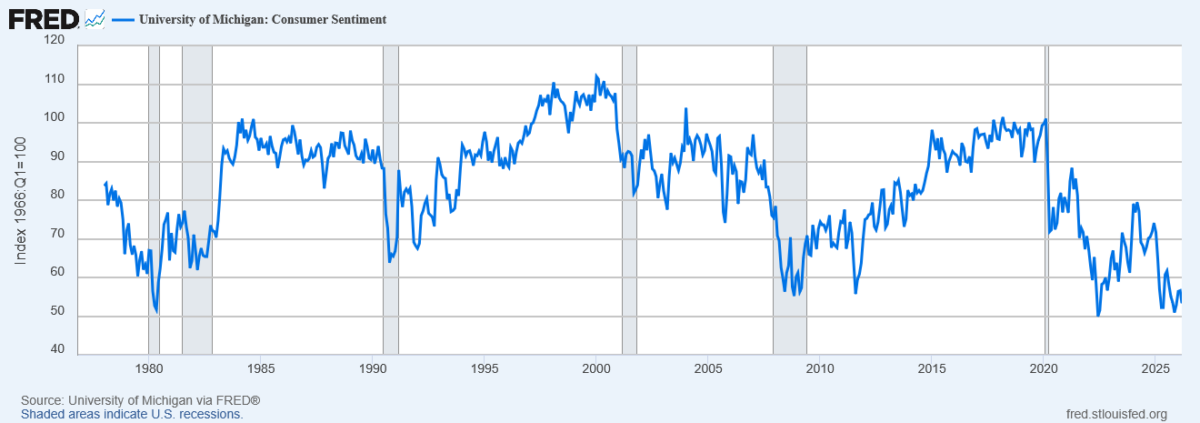
The drop in consumption spending following historical oil shocks has usually been led by the auto sector. Auto sales so far seem to have been holding up.
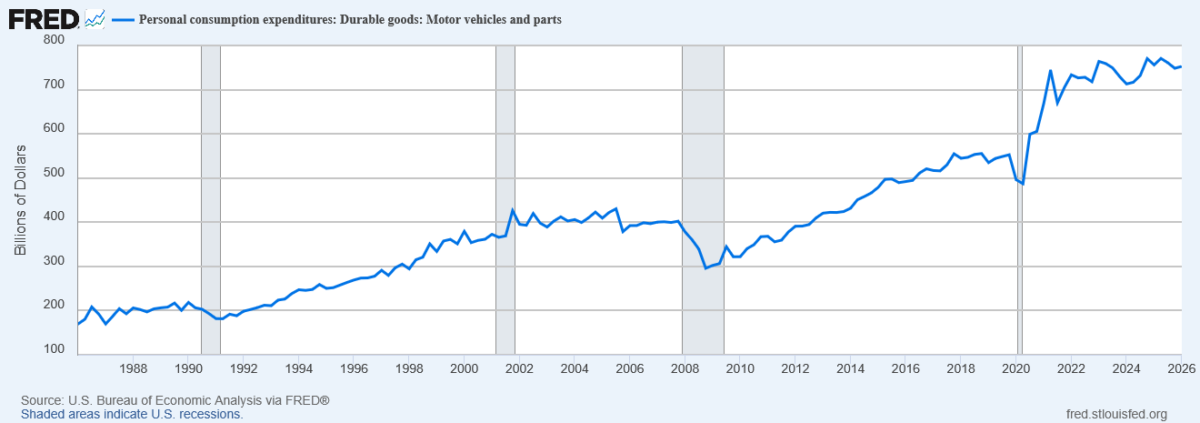
Nominal personal consumption expenditures on motor vehicles and parts, 1986:Q1-2026:Q1. Source: FRED.
The price of oil today is still below where it was four years ago. That may be part of why the recent oil price spike has not yet disrupted spending on autos and other goods more. But I am surprised that the price of oil right now isn’t higher. The IEA estimates that the conflict in Iran has cut world oil production by 10 million barrels per day, or about 10% of world production. We’ve seen nowhere near that big a drop in consumption of oil at this point. Consumers are being shielded from the full impact by sales out of inventories in the form of a drop in the amount of oil being stored on land and sea.
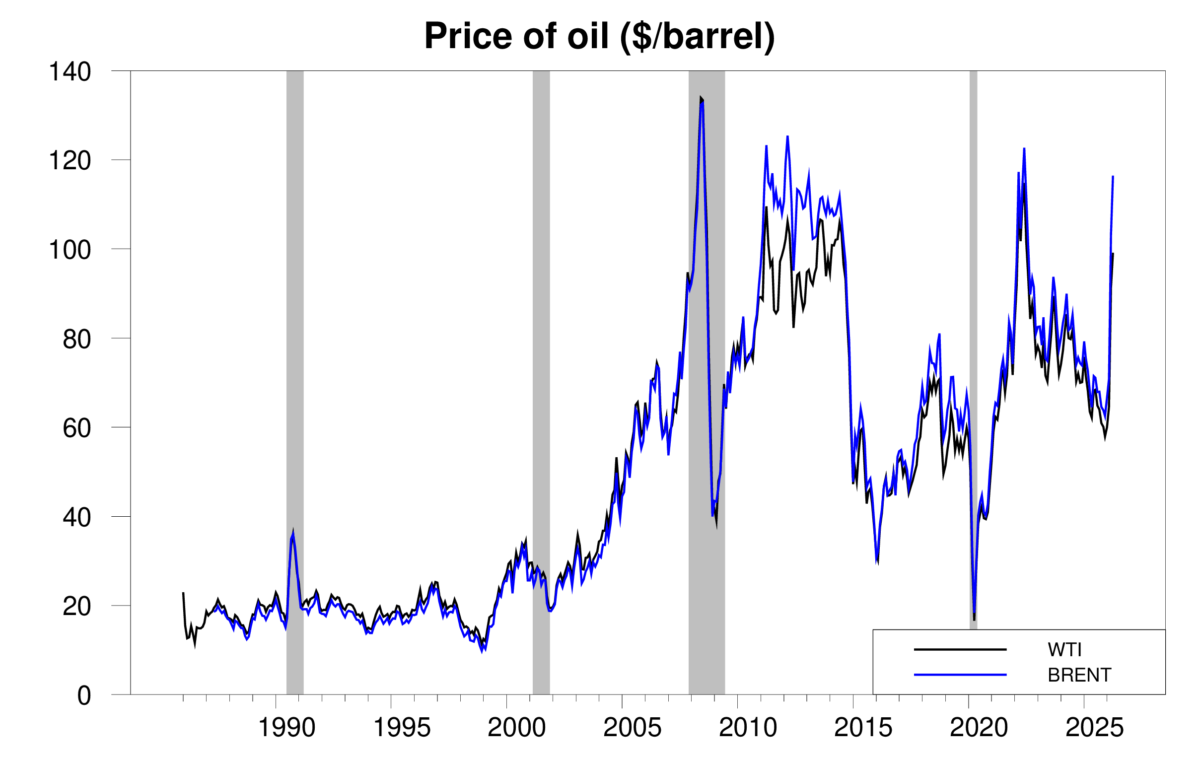
Selling out of inventories is the way markets are supposed to respond to temporary supply disruptions to cushion the economic impact. Wall Street seems to be counting on a quick resolution of this conflict. I hope the optimists are right. But I see a significant probability they are not. If the world needs to get by with 10% less oil for a prolongued period, we’re in for a much bigger drop in economic activity. The current sky-high stock market seems to be betting there’s not much danger of that. I think the market may be wrong.
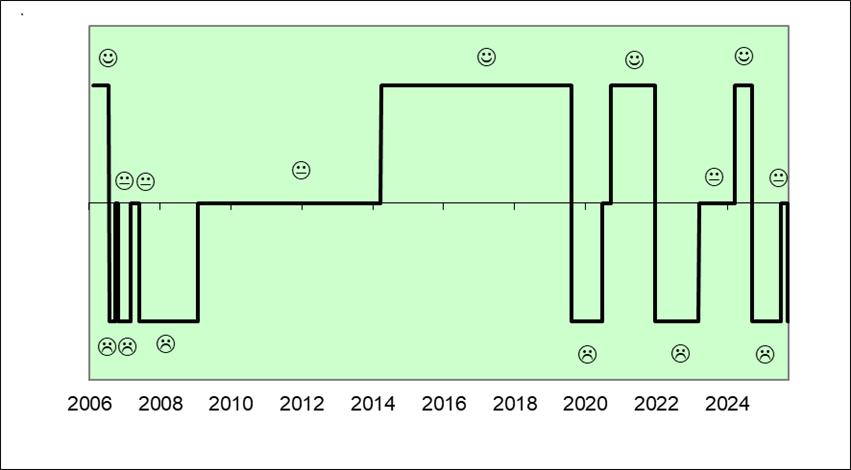
I’m moving our Little Econ Watcher’s countenance back to worried until we get some better news out of the Middle East.
Source link