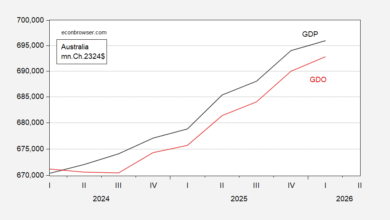
Third release on GDP. We now have a reading on GDO, as well as an updated view on GDP+.
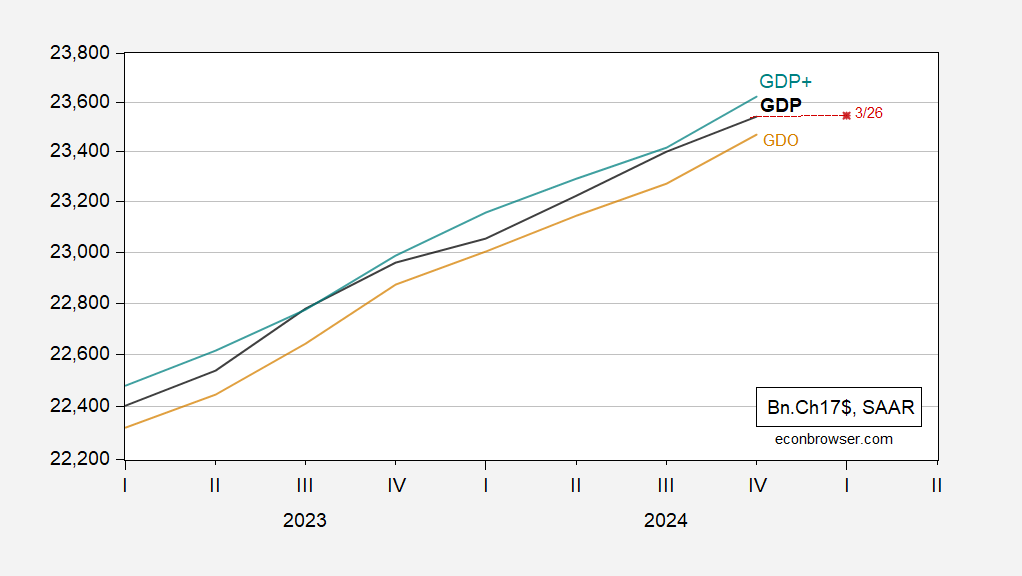
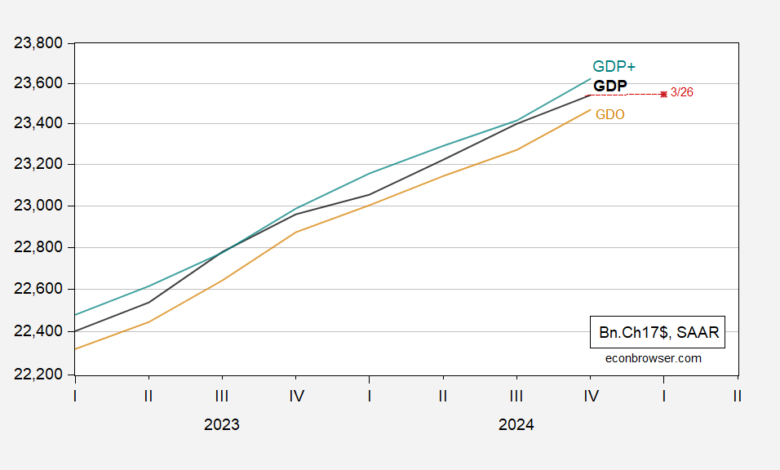
Figure 1: GDP (black), GDO (tan), GDP+ (green), GDPNow of 3/26, adjusted for gold imports of (red square), all in bn.Ch.2017$ SAAR. Source: BEA 3rd release, Philadelphia Fed, Atlanta Fed, and author’s calculations.
Note that I am plotting not the standard GDPNow, but the one accounting for gold imports. The standard, unadjusted, reading is -1.8%.
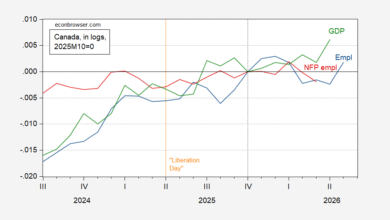
The downshift in growth that is nowcasted is made more profoundly clear when looking at q/q growth rates:
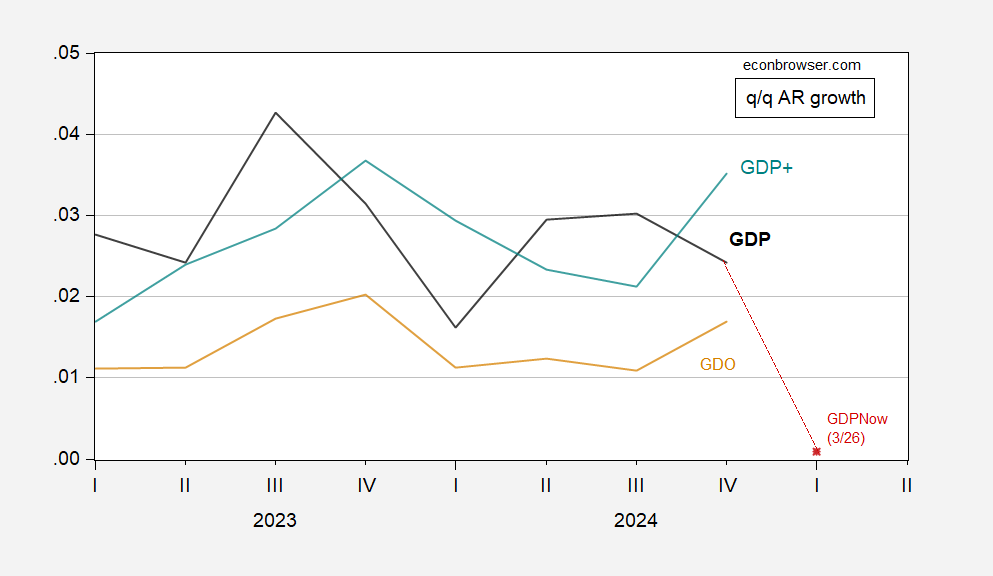
Figure 2: GDP (black), GDO (tan), GDP+ (green), GDPNow of 3/26, adjusted for gold imports of (red square), all q/q growth rates annualized (calculated as log differences). Source: BEA 3rd release, Philadelphia Fed, Atlanta Fed, and author’s calculations.
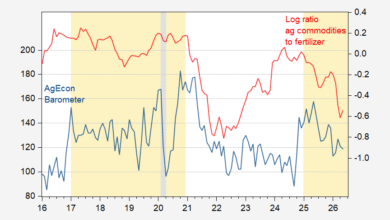
One of the big contributors to the deceleration in nowcasted consumption growth in Q1: 0.5% vs 2.9% in Q4.
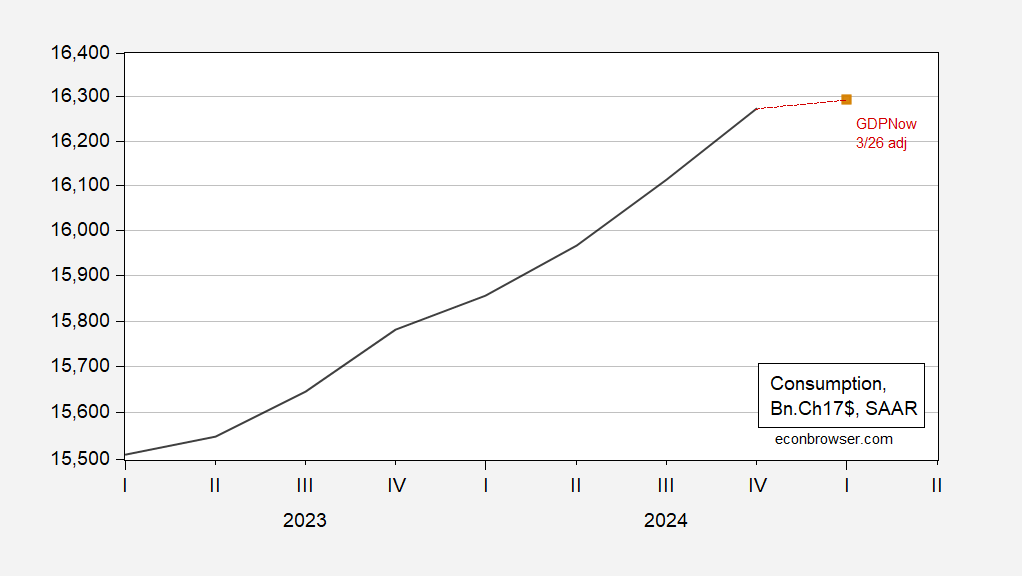
Figure 3: Consumption (black), and GDPNow of 3/26, adjusted for gold imports (red square). Source: BEA 3rd release, Atlanta Fed and author’s calculations.
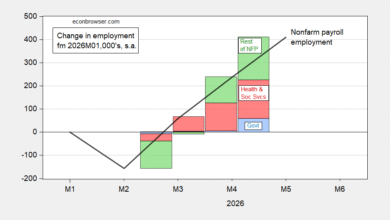
GDPNow tomorrow will reflect the consumption numbers for February, coming in the income and spending release.
Source link