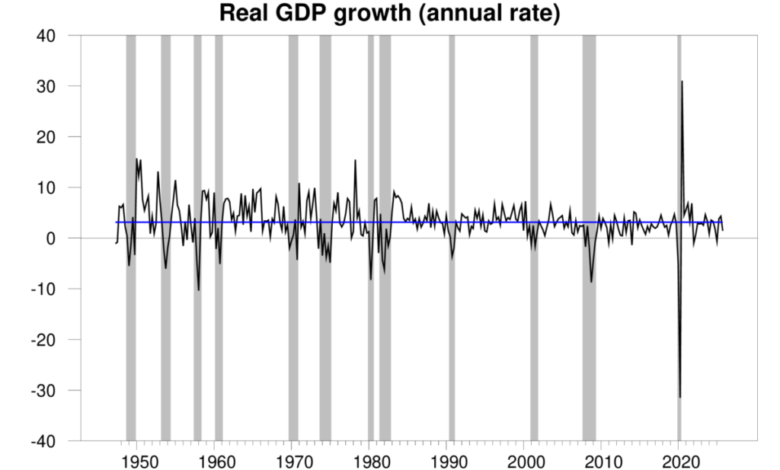
The Bureau of Economic Analysis announced today that seasonally adjusted U.S. real GDP grew at a 1.4% annual rate in the fourth quarter. That is a bit below the historical average growth of 3.1% and also below some analysts’ expectations for the Q4 numbers.
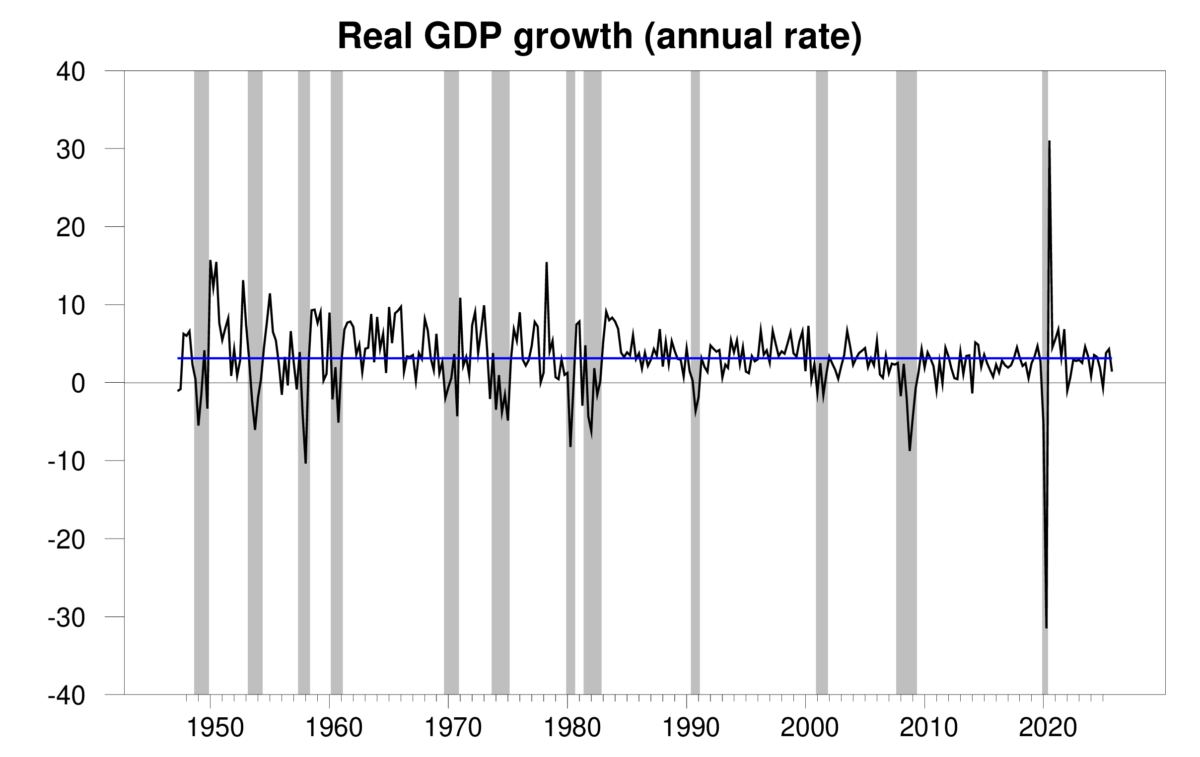
Quarterly real GDP growth at an annual rate, 1947:Q2-2025:Q4, with the historical average since 1947 (3.1%) in blue. Calculated as 400 times the difference in the natural log of real GDP from the previous quarter.
The new numbers bring the Econbrowser recession indicator index down to 1.8%, a historically very favorable level. This is dominated by the strong growth reported for Q3, which is the quarter that the index is designed to describe. Our procedure has always been to wait a quarter for data revisions and better pattern recognition before announcing the index for Q4.
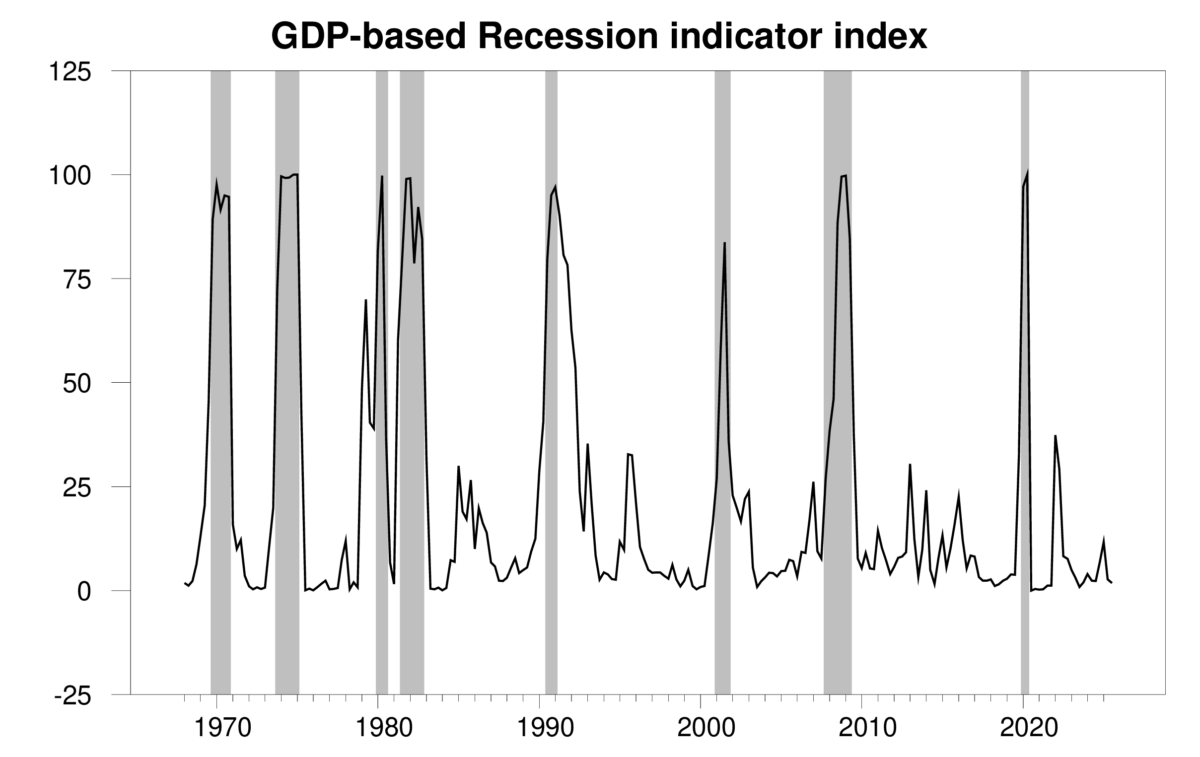
GDP-based recession indicator index. The plotted value for each date is based solely on the GDP numbers that were publicly available as of one quarter after the indicated date, with 2025:Q3 the last date shown on the graph. Shaded regions represent the NBER’s dates for recessions, which dates were not used in any way in constructing the index.
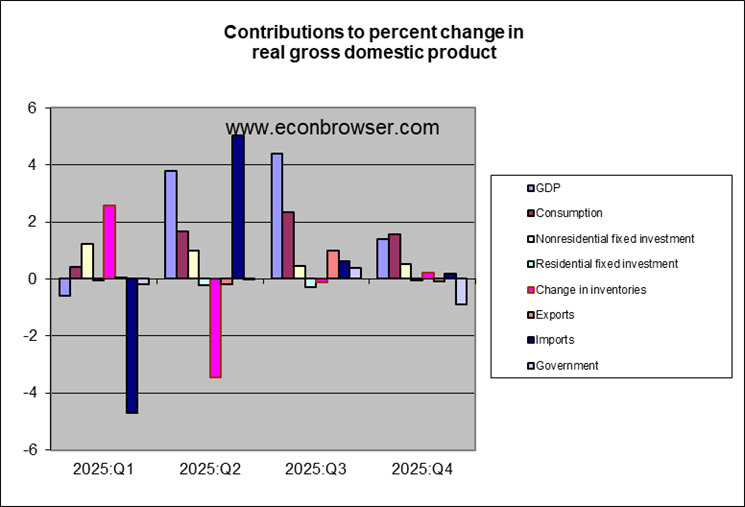
Consumption growth alone could account for more than all of the growth in GDP, with net negative contributions of the other components despite stronger nonresidential fixed investment. Lower government spending alone would have subtracted almost a full percentage point.
Although growth is a little slower than might be hoped for, inflation continues to be clearly higher than the Fed’s 2% target. This gives the Fed little incentive for another rate cut at the next meeting. The continued growth also prompts me to bring our Little Econ Watcher’s countenance back to neutral.
Source link