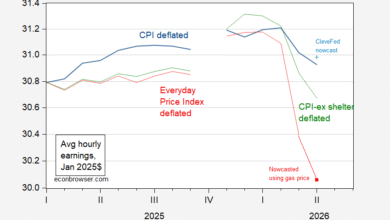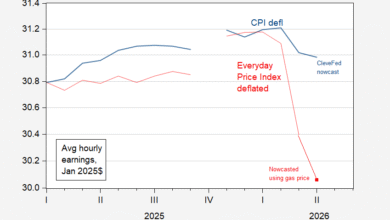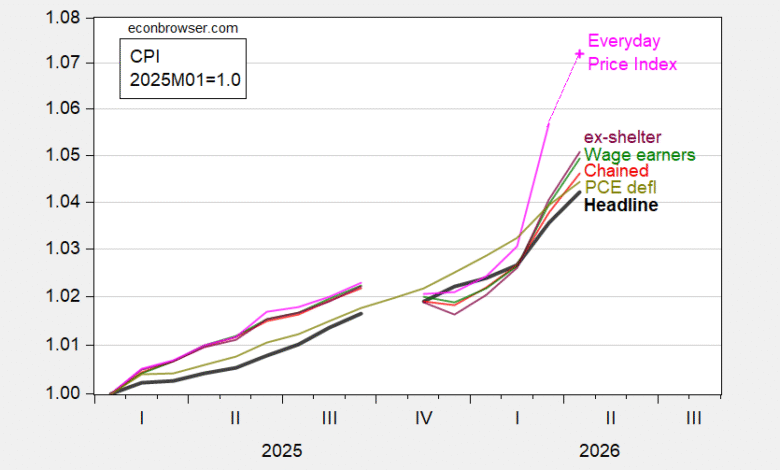
Everyday prices outstripping measured CPI and subindices:
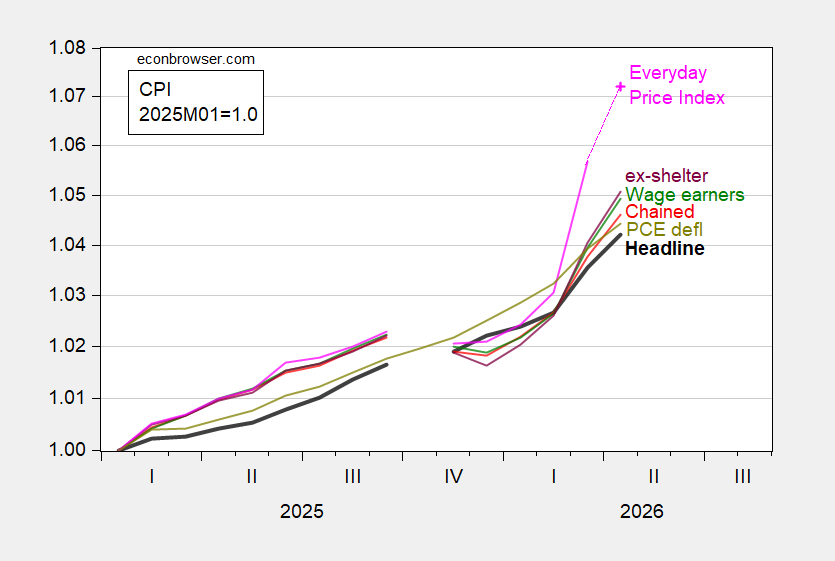
Figure 1: CPI-all urban (bold black), CPI wage earners and clerical (green), CPI ex-shelter (purple), CPI chained (red), PCE deflator (chartreuse), AIER Everday Price Index (pink), all 2025M01=1.0, on log scale. Chained CPI is n.s.a. April AIER EPI is nowcasted using gasoline price changes. April PCE deflator is nowcasted as of 5/11. Source: BLS, BEA via FRED, AIER, Cleveland Fed, and author’s calculations.
AIER has not yet reported the Everyday Price Index for April. I nowcast EPI usign a EPI-gas price regression that has an adjusted R2 of 0.87, SER of 0.002, with a statistically significant coefficient of 0.10 (each 1% increase in gasoline prices is associated with a 0.1% increase in the AIER EPI).
Core has also accelerated, with the exception of supercore (CPI ex food, fuel and housing).
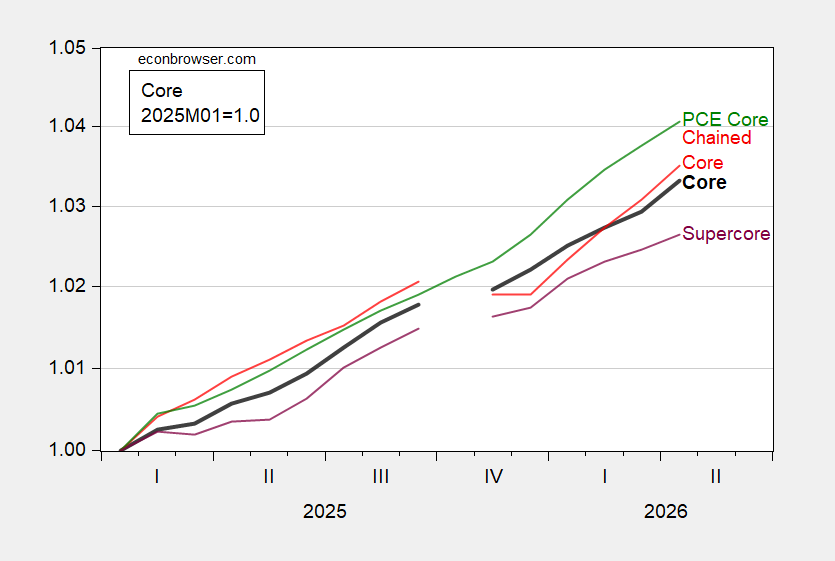
Figure 2: Core CPI-all urban (bold black), CPI chained core (red), CPI supercore (purple), PCE core deflator (green), all 2025M01=1.0, on log scale. Chained CPI is n.s.a. April PCE core is nowcasted as of 5/11. Source: BLS, BEA via FRED, BLS, Cleveland Fed, and author’s calculations.
Source link