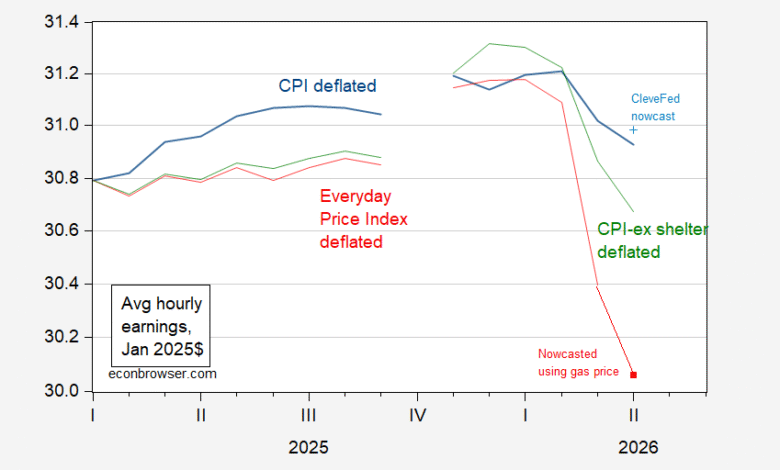
Using today’s CPI release:
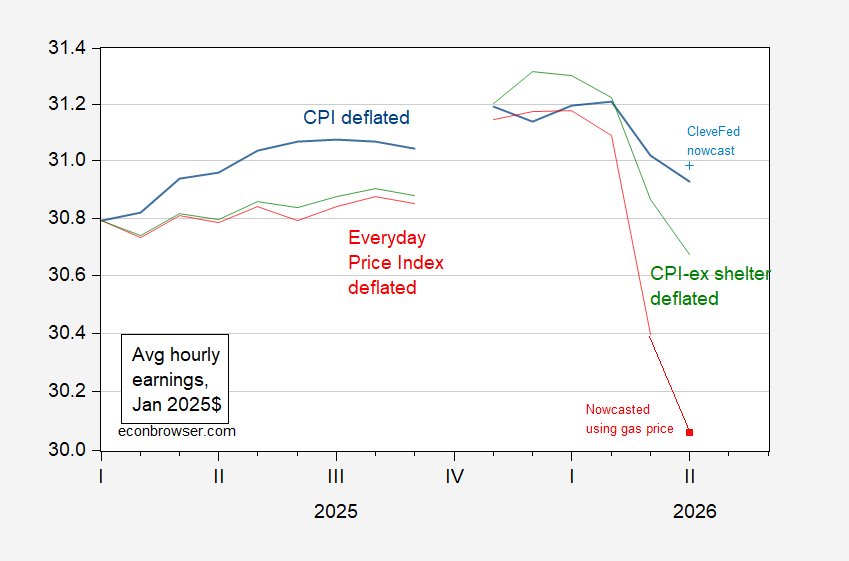
Figure 1: Average hourly earnings deflated by CPI (blue), Cleveland Fed nowcast as of 5/11 (light blue +), by CPI-ex shelter (green), by AIER’s “Everyday Price Index” (EPI) (red), both in January 2025$. AIER EPI for April is obtained from a 2023M04-2026 regression of log first differences of EPI on gas prices. Source: BLS, EIA via FRED, AIER EPI, and author’s calculations.
The reported April CPI exceeded the Clevelad Fed nowcast, though matched Bloomberg consensus. There was an aspect of the way the BLS handled the rent component during the shutdown which pushed upward the CPI; hence, I also plot CPI ex-shelter. This has fallen even more over the past months so that the real wage so defined is even lower than at the beginning of Trump administration 2.0.
AIER has not yet reported the Everyday Price Index for April. Relying upon the nowcasted EPI, I find the real wage much lower than 2025M01. The EPI-gas price regression has an adjusted R2 of 0.87, SER of 0.002, with a statistically significant coefficient of 0.10 (each 1% increase in gasoline prices is associated with a 0.1% increase in the AIER EPI).
Source link