
Economy
-

Measured Trade Uncertainty Spikes | Econbrowser
Graph for data through 5/30 for Baker, Bloom and Davis index. Figure 1: EPU-trade category (blue, left scale), and Trade…
Read More » -

Trump Predicts at Least 3% Growth
At least it’s mercifully less than the 4% that he promised last time (but 9% is more than last time)…
Read More » -

Despite Upward Revisions, Sentiment Still Looks Pretty Poor
Final May figures for Michigan survey are out. As noted in the release, final figures are more positive with the…
Read More » -

Business Cycle Indicators as Reported at May’s End
Consumption level is revised downward, while personal income ex transfers continues to rise. Manufacturing and trade sales rise in March.…
Read More » -

Stephen Moore Critiques the CBO
Mr. Moore continues his reign of (economic) errors, now tackling the CBO’s (and JCT’s) record on predictions, in “Save us…
Read More » -

What Does a Rising Long Term US Government Yield Mean?
I was thinking about this, as people were remarking on how the 30 year bond was rising. First, let’s think…
Read More » -

Economic Activity: GDP, GDO, GDP+, Final Sales
As of 2nd release for 2025Q1. Figure 1: GDP (bold black), GDO (light blue), GDP+ based on 2022Q4 GDP (tan),…
Read More » -
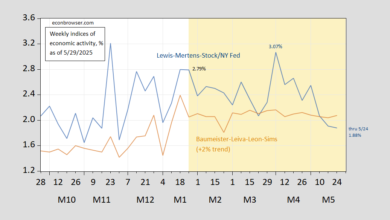
Weekly Indicators of GDP Growth
The Lewis-Mertens-Stock/NY Fed measure for data through 5/24 is down to 1.88%, down from 2.79% on the week of Trump’s…
Read More » -
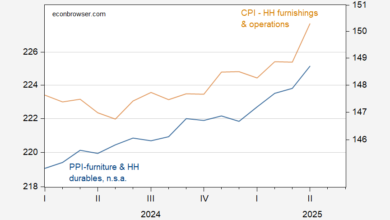
Furniture Prices Up, Up and Away in April
Can’t wait to see May data. Figure 1: PPI for furniture and household durables, n.s.a. (blue, left log scale), and…
Read More » -
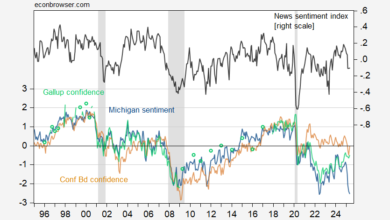
Some Stabilization in Economic Confidence
While (UMich) economic sentiment (preliminary) falls. Figure 1: University of Michigan Consumer Sentiment (blue, left scale), Conference Board Consumer Confidence (tan,…
Read More »