The key indicators followed by the NBER Business Cycle Dating Committee, in light of today’s employment release, is discussed here. However, several alternative indicators have been proposed (some of dubious usefulness, like Vehicle Miles Traveled and gasoline consumption). Here’s a graph over the corresponding time period, normalized to 2022M11.
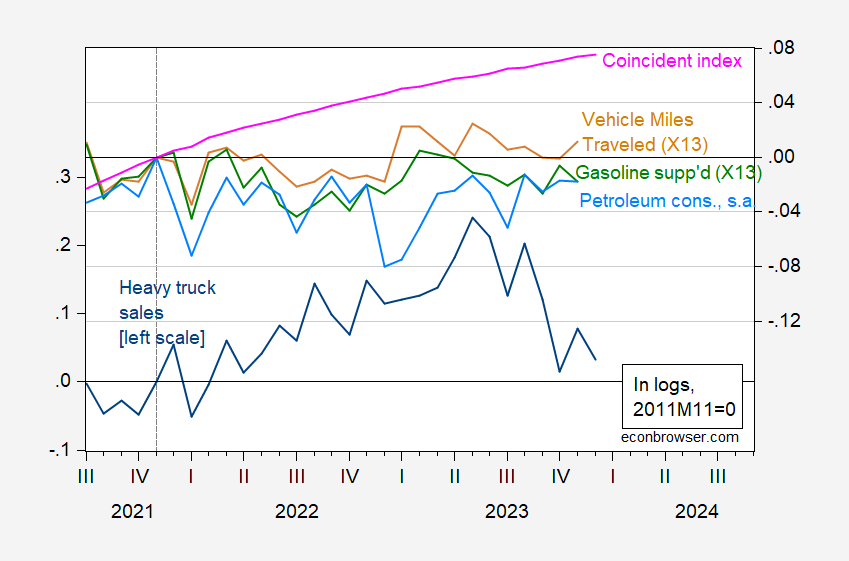
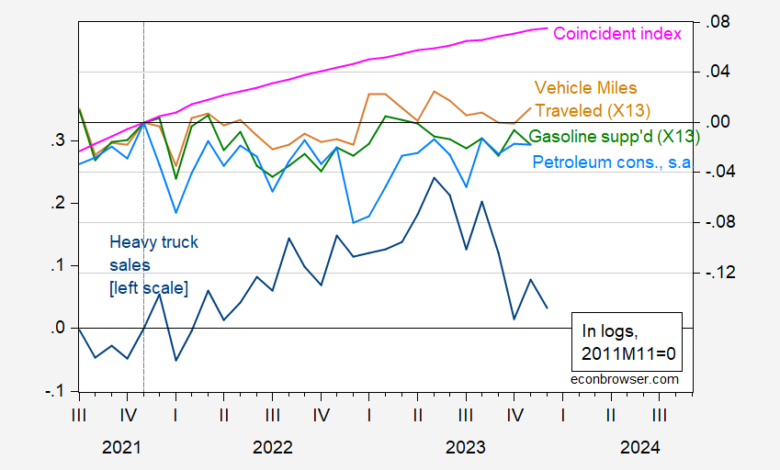
Figure 1: Heavy truck sales (blue, left scale), coincident index (pink, right scale), vehicle miles traveled seasonally adjusted using X13 (tan, right scale), gasoline supplied seasonally adjusted using X13 (green, right scale), petroleum consumption seasonally adjusted (sky blue), all in logs, 2022M11=0. Source: Census, Philadelphia Fed, NHTSA via FRED, DoE EIA, and author’s calculations.
While petroleum products supplied, and gasoline consumption have trended sideways, I think these are indicators of limited usefulness in these times. Vehicle miles traveled have been somewhat higher over 2023, and are rising through November. The coincident index, based primarily on labor market indicators, continues to rise, so that buttresses the case for no downturn in December. What is falling is heavy truck sales, although it has not plumbed negative rates of growth consistent with a recession.
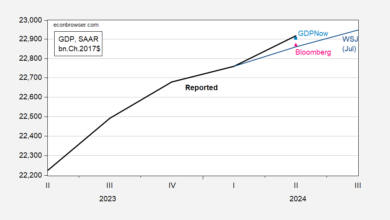
In addition, one can look to GDO and the Sahm rule for further confirmation of no-recession. We don’t have GDO for 2023Q4 (because we don’t have GDI for that quarter). However, if we assume the net operating surplus is the same in Q4 as Q3 in nominal terms, we can guesstimate GDI and hence GDO.
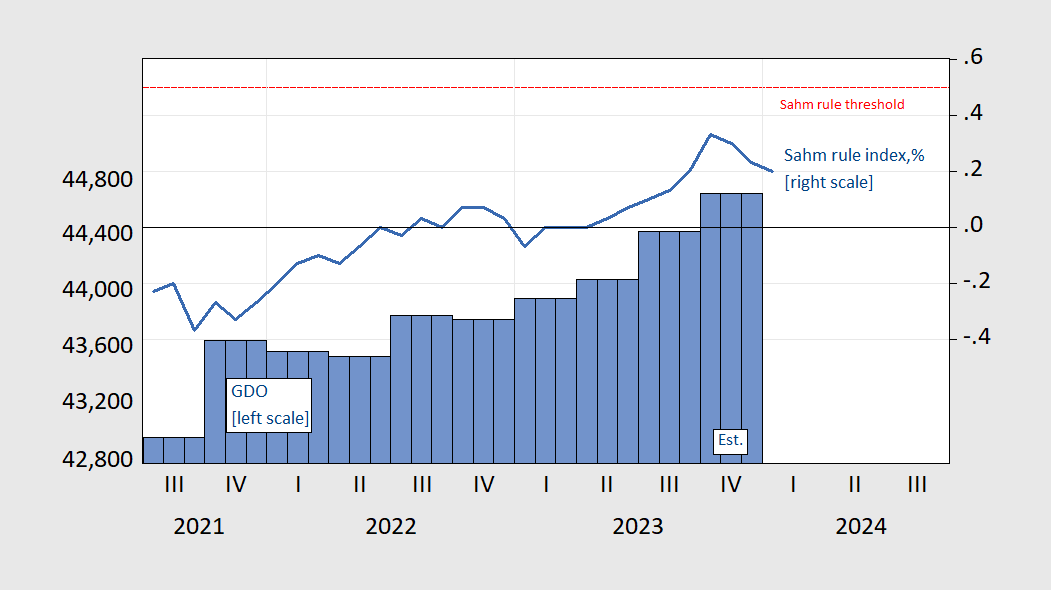
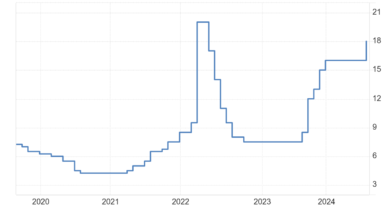
Figure 2: GDO in bn.2017$ SAAR (blue bar, left scale), and Sahm rule index, real-time, % (blue line, right scale). 2023Q4 value for GDO is based on assuming nominal net operating surplus is constant at 2023Q3 levels. Horizontal dashed red line is threshold for recession. Source: BEA, FRED, and author’s calculations.
The Sahm rule indicator suggests that we are not in a recession as of January 2024; furthermore, the indicator is moving away from the threshold. Of course, it’s possible to retrace upwards and the economy go into a recession, but in the past 50 years, this has only happened once (hits threshold in 1969M10, falls and then breaches the threshold in 1970M02. NBER dates the peak at 1969M12).
Source link