Possibly one factor in the impact of oil shocks (although Blanchard and Gali (2007) place greater weight on greater wage flexibility and central bank credibility):
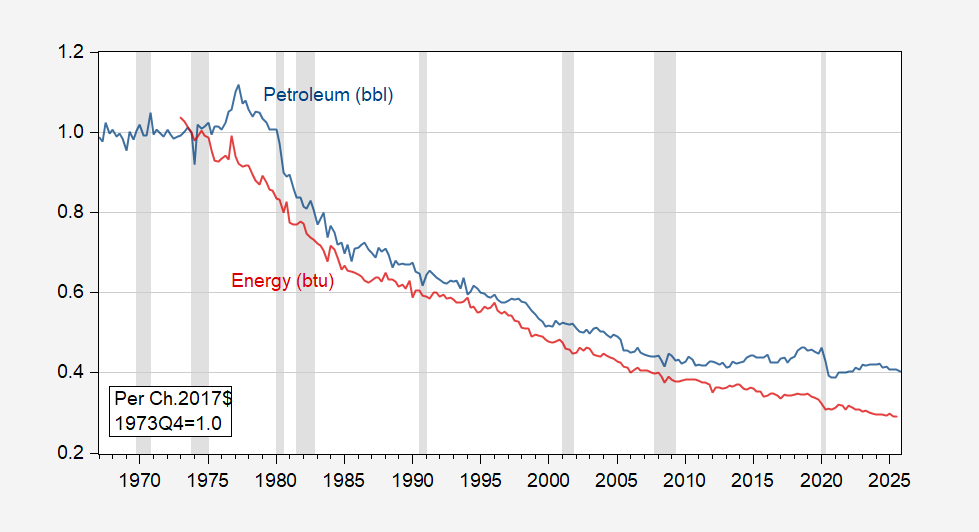
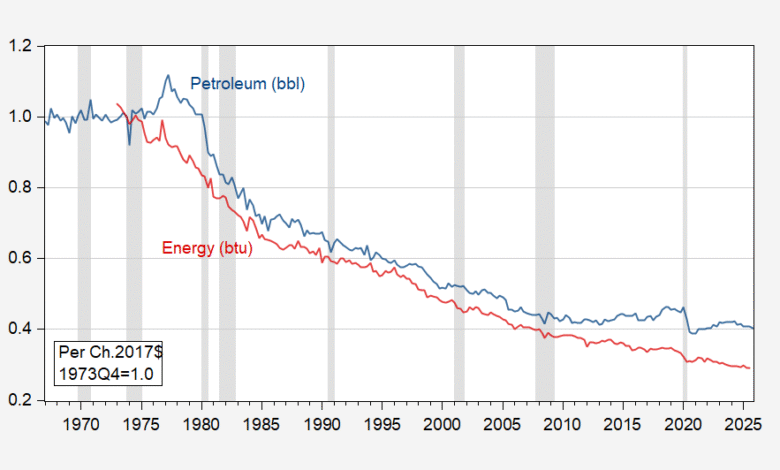
Figure 1: Petroleum intensity of real GDP (blue), and energy intensity of real GDP (red), normalized 1973Q4=1. Petroleum is in billions of barrels. Energy is sum of residential, commercial and industrial production, plus transportation production, in trillions of BTU. NBER defined peak-to-trough recession dates shaded gray. Source: EIA, BEA 2025Q4 second release.
Given the size of the oil price shock, it’s a good thing — at least in my mind — that the oil intensity of US GDP has decreased so much since 1973, even if other factors are important in the propagation mechanism. One might even go so far as to conclude the administration’s recent attempts to sabotage moves toward greater reliance on renewables has proved foolhardy.
For more on explanations for the decreased impact on output and inflation, see Hamilton (2018).
Source link